


Overview:
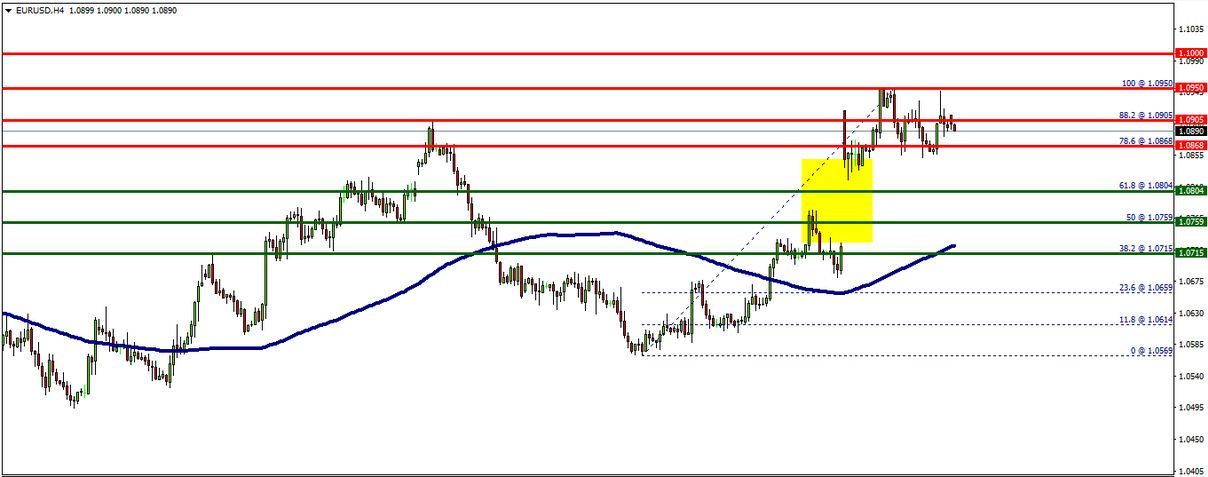
The EUR/USD pair continues to rise from the level of 1.0868 on the longer-term basis. It should be noted that the support is established at the level of 1.0868 which represents the 78.6% Fibonacci retracement level on the H4 chart. The price is likely to form a minor support in the same time frame. Accordingly, the EUR/USD pair is showing signs of strength following a breakout of the highest levels of 1.0868 and 1.0804. So, buy above the level of 1.0868 with the first target at 1.0950 in order to test the daily resistance 1 and the next one at 1.1000. Besides, the level of 1.1000 is a good place to take profit because it will form a new double top. On the other hand, in case a reversal takes place and the EUR/USD pair breaks through the support level of 1.0804, a further decline to 1.0715 can occur which would indicate a bearish market.


