


Gold price is vulnerable to move towards $1,250. The short-term trend remains bearish. However, I favor long positions in the area of $1,245-60 targeting a move above $1,300. Gold remains in a longer-term bullish trend towards $1,500-$1,600.
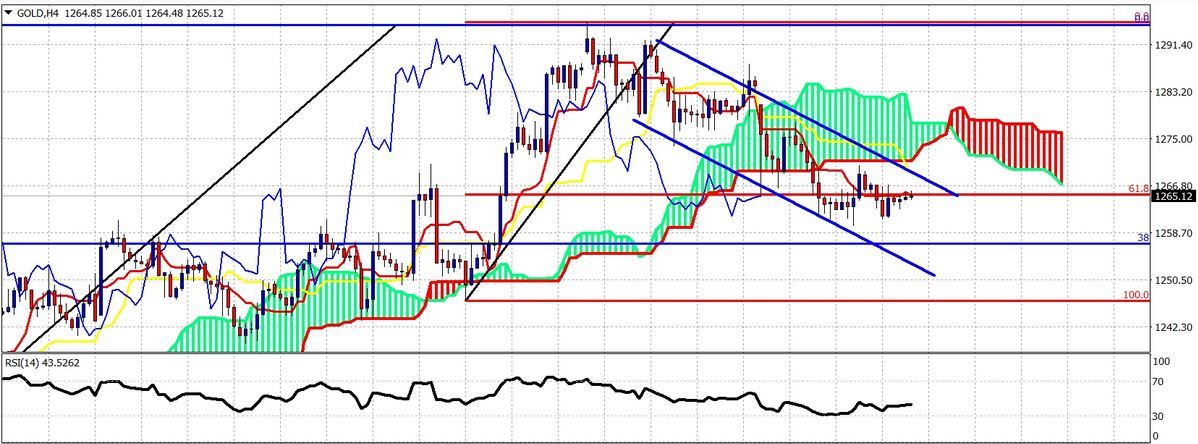
Blue lines – bearish channel
Gold price remains inside the bearish channel and below the cloud resistance. The price is trading around the Tenkan-Sen (red line indicator). Bulls need to break the bearish channel and push above the Kumo cloud to allow cloud indicators to remain positive. A cross of the kijun-sen below the tenkan-sen will be a bearish signal.
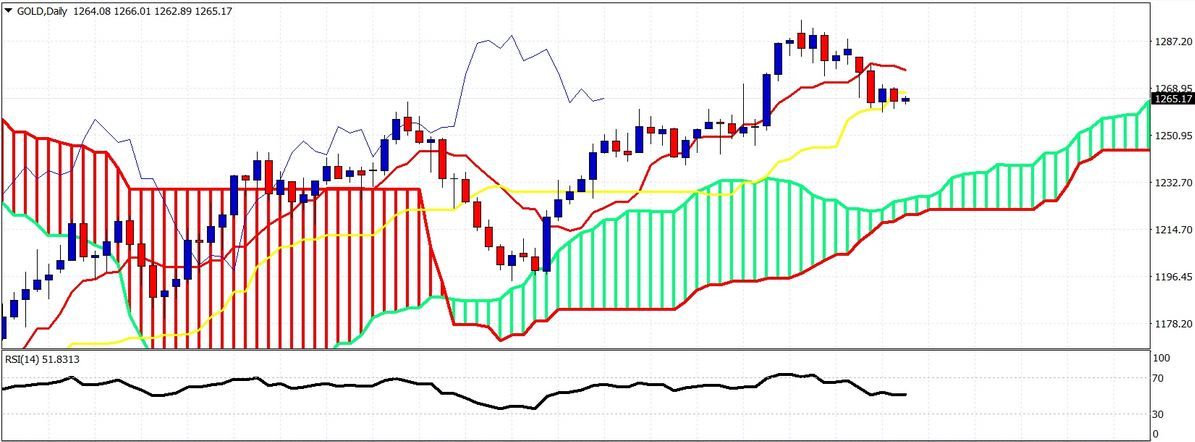
Gold price closed below the kijun-sen yesterday and is trying to push back above it today. The daily resistance is found at the tenkan-sen (red line indicator) at $1,276. Daily cloud support lies at $1,230. I remain bullish in the longer term.


