


GBP/USD remains steady in a consolidation range despite the USD sell-off triggered after French election’s results. Between the 1.2875 and 1.2728 levels, we’ve been following a narrow range in favor of the bullish bias. With a breakout above 1.2875, we can target the next key area at the 1.3029 level, while a pullback should make the Cable to test the 200 SMA at H1 chart.
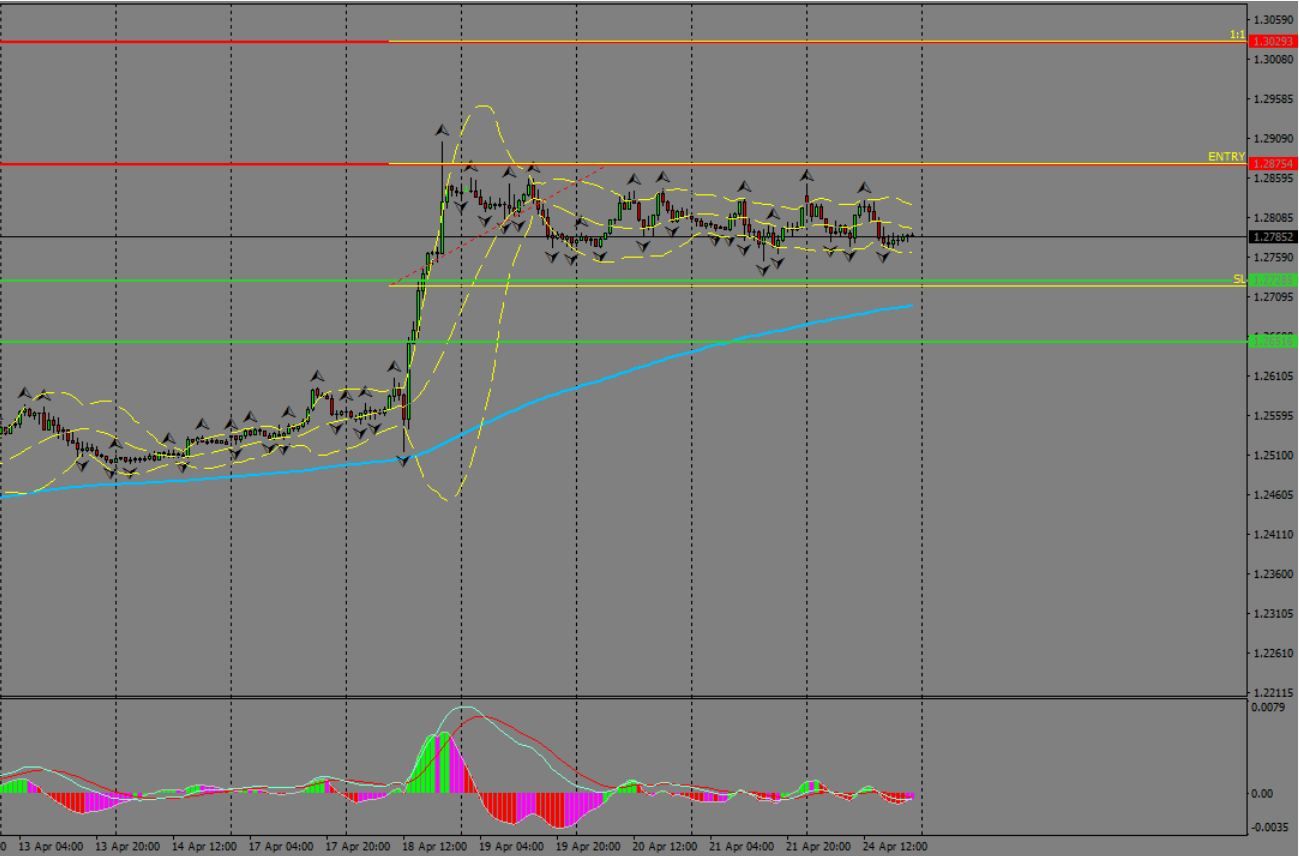
H1 chart’s resistance levels: 1.2875 / 1.3029
H1 chart’s support levels: 1.2728 / 1.2652
H1 chart’s support levels: 1.2728 / 1.2652
Trading recommendations for today: Based on the H1 chart, buy (long) orders only if the GBP/USD pair breaks a bullish candlestick; the resistance level is at 1.2875, take profit is at 1.3029 and stop loss is at 1.2723.


