


Gold price made a sharp move lower yesterday below $1,280 and almost reached our first target of $1,270. The inability to break above $1,293 pushed prices lower as we expected. Gold could continue even lower towards $1,250-60 but my overall longer-term view remains unchanged and bullish.
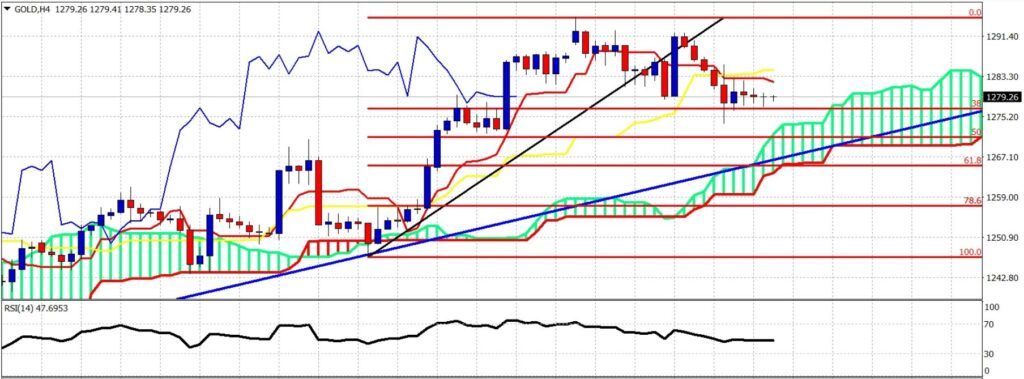
Gold price decline stopped at the 38% Fibonacci retracement. Price is above the 4-hour cloud but below both the tenkan- and kijun-sen indicators. Resistance by these two indicators is at $1,283-85. So the first resistance bulls need to break is at $1,283-85. Next and most important one is at $1,293. Short-term support is found at $1,275-70 where the Kumo is found.
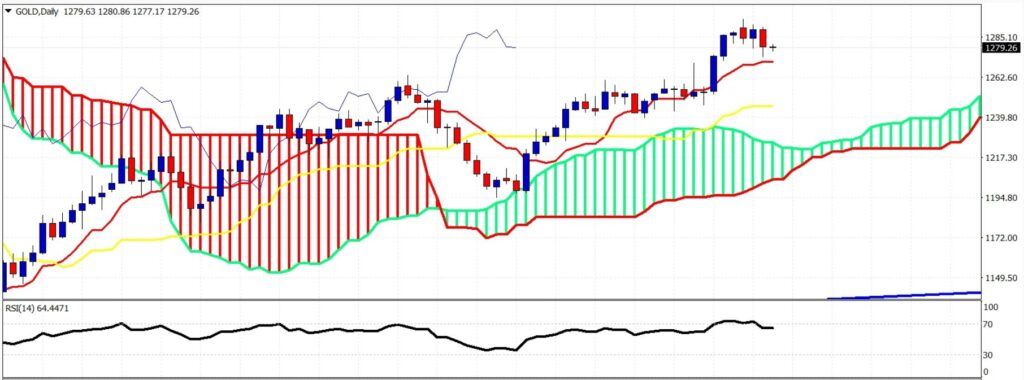
On a daily basis Gold should make a pullback towards at least the kijun-sen (yellow line indicator) at $1,245. A break and daily close below the tenkan-sen (red line indicator) at $1,270 will increase the chances of this happening. This is not the time to adding to longs. A pullback towards $1,245 will be the best opportunity.


