


The US dollar index has not bottomed yet. The trend remains bearish. I expect the index to decline further as we are about to test very important long-term support levels. At 98.80-99 price level many things about the medium- and longer-term trend will clear up, and we will have a better picture of the most probable scenario.
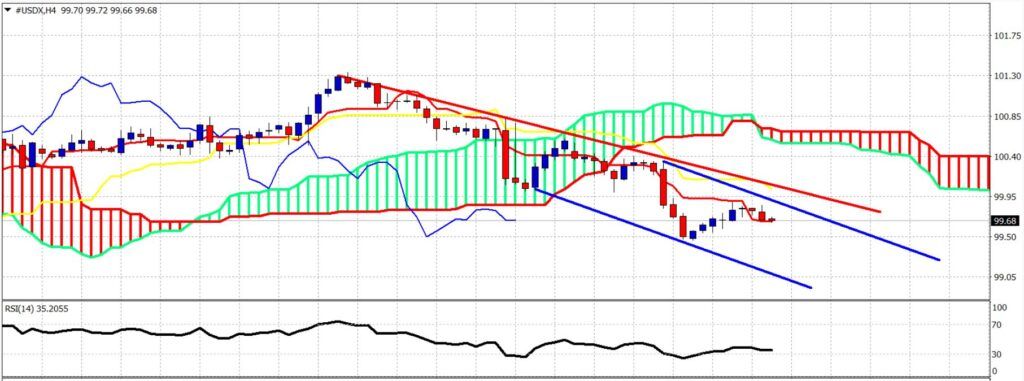
Red line – resistance Blue lines – bearish channel The dollar index is making lower lows and lower highs. The price is below the 4-hour Kumo cloud and the kijun-sen (yellow line indicator) while trading around the tenkan-sen. The short-term resistance is at 99.95 while the support lies at 99.40. I expect the dollar index to make a new low towards 99.
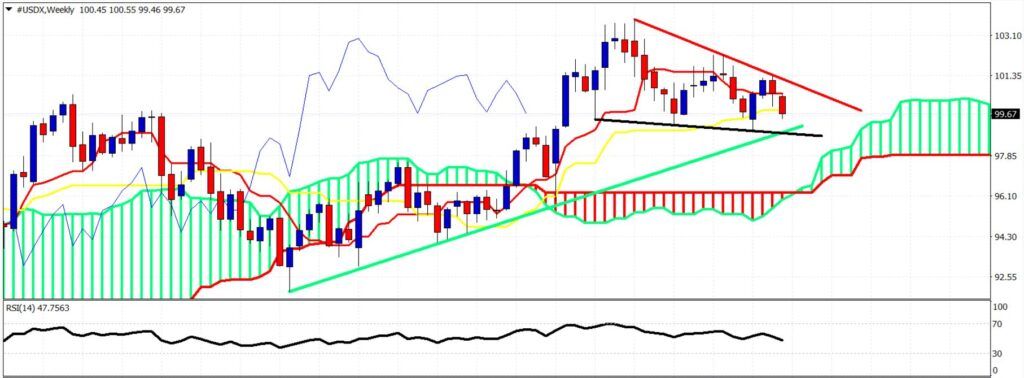
Red line – resistance Black line – support Green line – long-term support trend line The dollar index is approaching the important junction where the long-term trend line is converging with the black trend line support. The price is still above the weekly Kumo cloud support, maintaining the bullish trend. However, a weekly close below the kijun-sen and a break below the green trend line will increase the chances of a bigger bearish reversal and trend change.


