


Gold price as expected is pushing lower towards $1,260 as we justified a correction from last week. The causation today are the French election results. Technically Gold price could continue lower towards $1,260 or even $1,250 but my longer-term view remains unchanged.
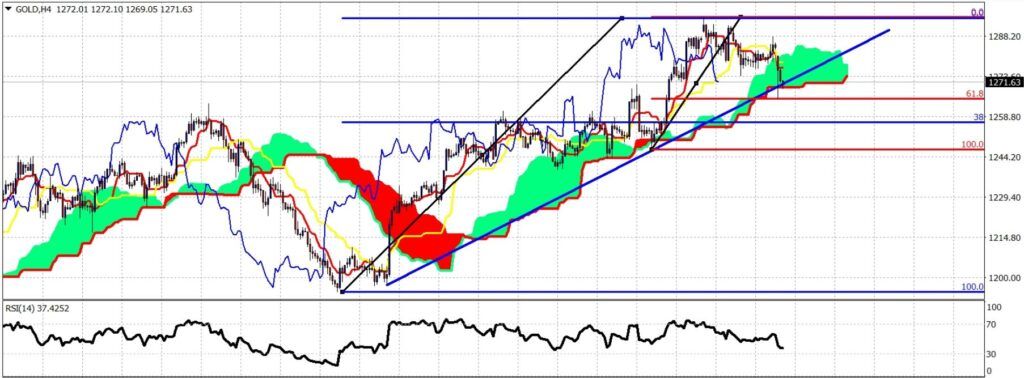
The gold price has reached the 61.8% Fibonacci retracement of the last move up from $1,240 and the lower cloud boundary. If support at $1,260 fails we should expect the Gold price to move towards the 38% Fibonacci retracement of the rise from $1,180. This support level is at $1,245.
Black line – resistance
Blue line – support
Blue line – support
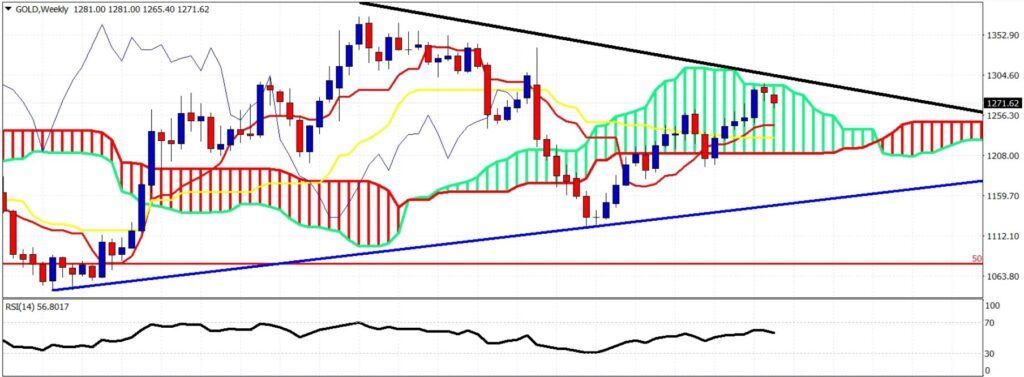
As we expected from last week Gold price got rejected at the upper cloud boundary and at the black long-term trend line resistance. Weekly support is at the red tenkan-sen indicator at $1,245. My longer-term view remains bullish. This downward move is most probably the last chance for long positions in Gold before the big breakout.


