The US dollar index is testing the important support area at 99-98.80 as we expected last week. It has broken below the support in early trading but we focus on the daily close after today’s session to confirm the support is broken. Therefore, dollar bears should be very cautious as a rapid reversal could start from current levels.
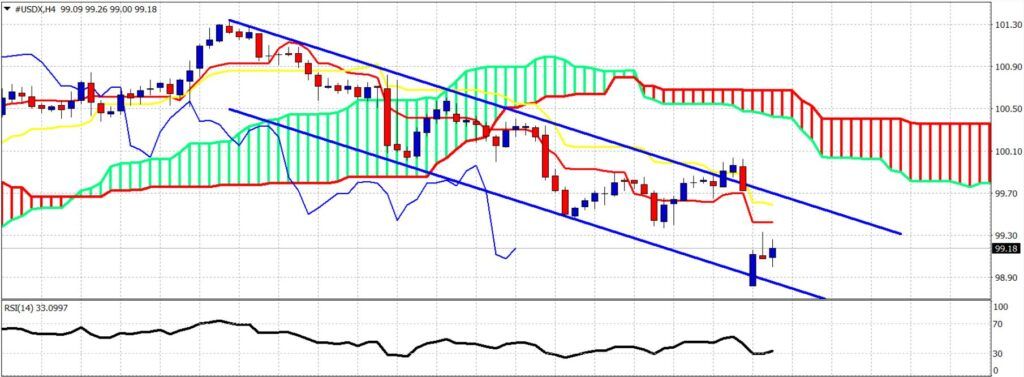
Blue lines – bearish channel
The dollar index remains below both the tenkan- and kijun-sen indicators. Support is at 98.80-99 and resistance lies at 99.70. The short-term oscillator justifies even a gap close at 99.70.
The dollar index remains below both the tenkan- and kijun-sen indicators. Support is at 98.80-99 and resistance lies at 99.70. The short-term oscillator justifies even a gap close at 99.70.
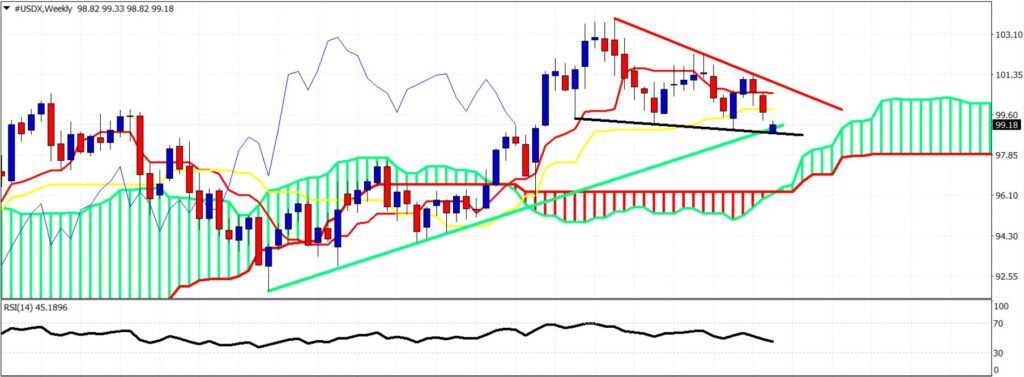
Red line – resistance
Green line – long-term support
Black line – trend line support
Green line – long-term support
Black line – trend line support
The dollar index is right on top of the important support. The chances of a full scale reversal to the upside are high. Bears should be very cautious. Important long-term resistance is at 100.80 and 101.30. Confirmation of a bullish reversal for the longer-term trend will come with a break above 102.30. Weekly close below 98.80 will be a clear bearish sign.