


Overview:
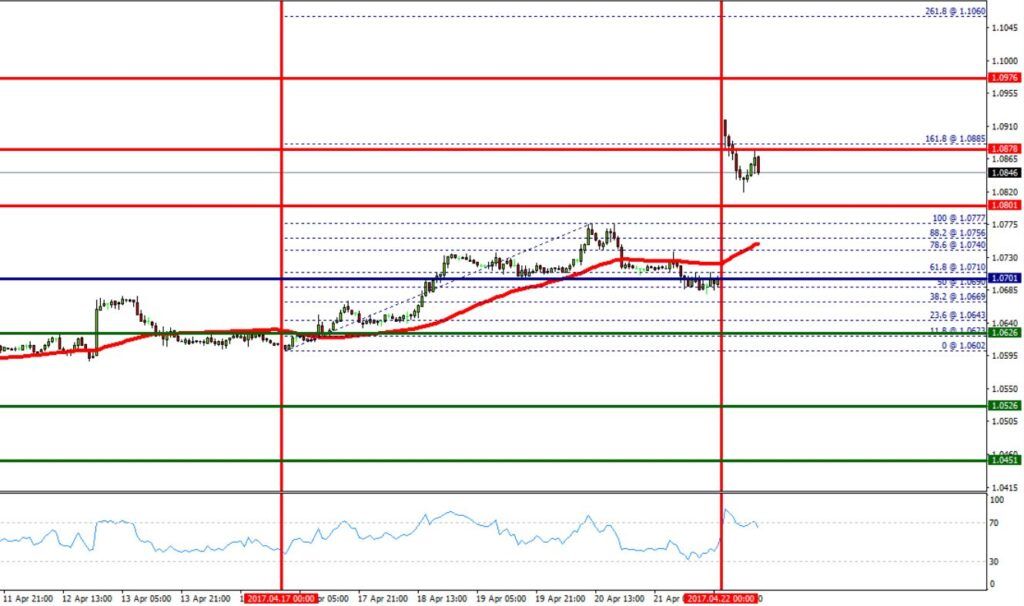
On the one-hour chart, the EUR/USD pair is indicating to a bullish trend from the support levels of 1.0801 and 1.0701. Currently, the price is in a bullish channel. Yesterday, the market opened above the levels of 1.0801 and 1.0701 with the reason for the gap. This is confirmed by the RSI indicator signaling that we are still in a bullish trending market. As the price is still above the moving average (100), immediate support is seen at 1.0801. Consequently, the first support is set at the level of 1.0801. So, the market is likely to show signs of a bullish trend around the spot of 1.0885. In other words, buy orders are recommended above the first resistance (1.0801) with the first target at the level of 1.0885. Furthermore, if the trend is able to breakout through the first resistance level of 1.0885. It should see the pair climbing towards the double top 1.0976. It would also be wise to consider where to place a stop loss; this should be set below the second support of 1.0701.Weekly technical analysis:
On the one-hour chart, the EUR/USD pair is indicating to a bullish trend from the support levels of 1.0801 and 1.0701. Currently, the price is in a bullish channel. Yesterday, the market opened above the levels of 1.0801 and 1.0701 with the reason for the gap. This is confirmed by the RSI indicator signaling that we are still in a bullish trending market. As the price is still above the moving average (100), immediate support is seen at 1.0801. Consequently, the first support is set at the level of 1.0801. So, the market is likely to show signs of a bullish trend around the spot of 1.0885. In other words, buy orders are recommended above the first resistance (1.0801) with the first target at the level of 1.0885. Furthermore, if the trend is able to breakout through the first resistance level of 1.0885. It should see the pair climbing towards the double top 1.0976. It would also be wise to consider where to place a stop loss; this should be set below the second support of 1.0701.Weekly technical analysis:
R3: 1.0976
R2: 1.0876
R1: 1.0801
PP: 1.0701
S1: 1.0626
S2: 1.0526
S3: 1.0451


