


Gold price is close to bottoming. Gold price has limited downside potential and could go as low as $1,245. I cannot see it lower than that area. Gold is expected to bounce strongly towards $1,300 and higher after the coming reversal.
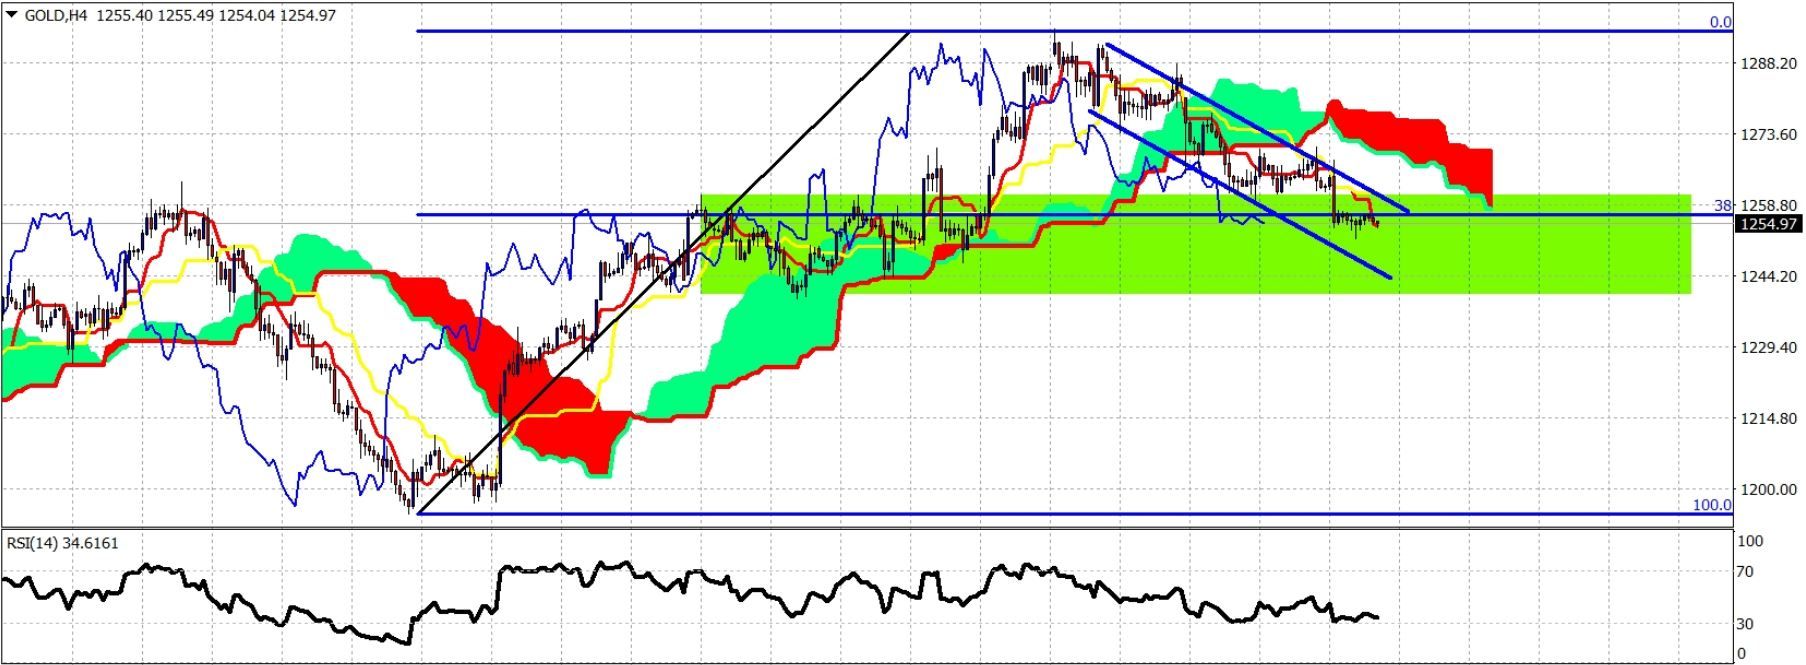
Blue lines – bearish channel
Green rectangle – support area
Green rectangle – support area
Gold price is inside the green rectangle support area. Price is below both the tenkan- and kijun-sen indicators. Trend is bearish for the short term. Short-term resistance is at $1,262. Next important resistance is at $1,272. Bulls need to break these levels to confirm a reversal.
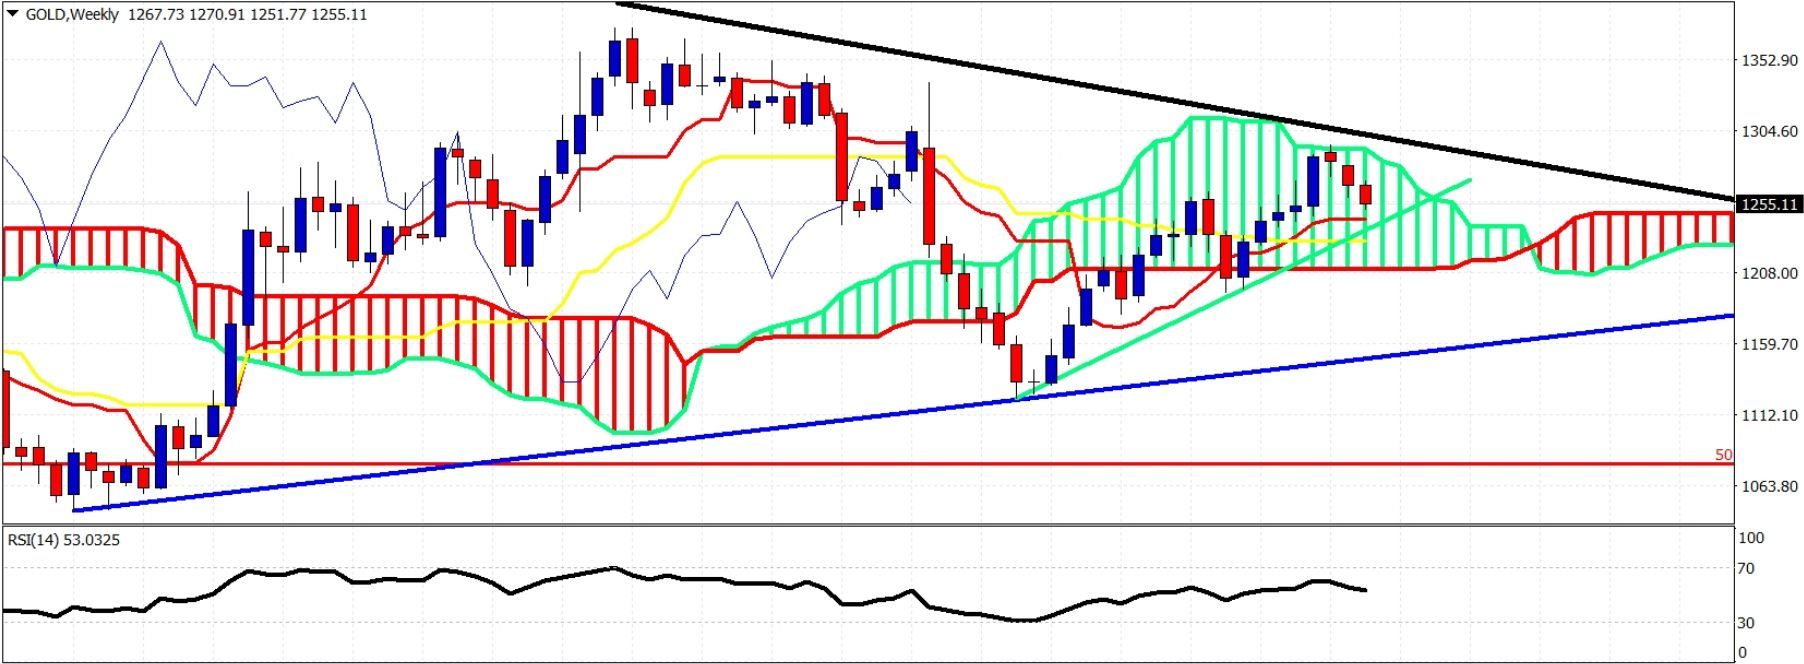
Black line -long-term resistance trend line
Blue line – long-term support trend line
Green line – medium term support trend line
Blue line – long-term support trend line
Green line – medium term support trend line
Gold price is trading inside the Kumo. Trend is neutral. Price is above both the tenkan- and kijun-sen. Price is also above the green medium-term support trend line. I expect this trend line to hold and price bounce upwards strongly above the long-term trend line resistance.


