


The Dollar index continues to trade sideways. Price has no clear direction but I believe one more final push lower towards 98 is very possible. However a break above 99.35 could signal that an important low is already in.
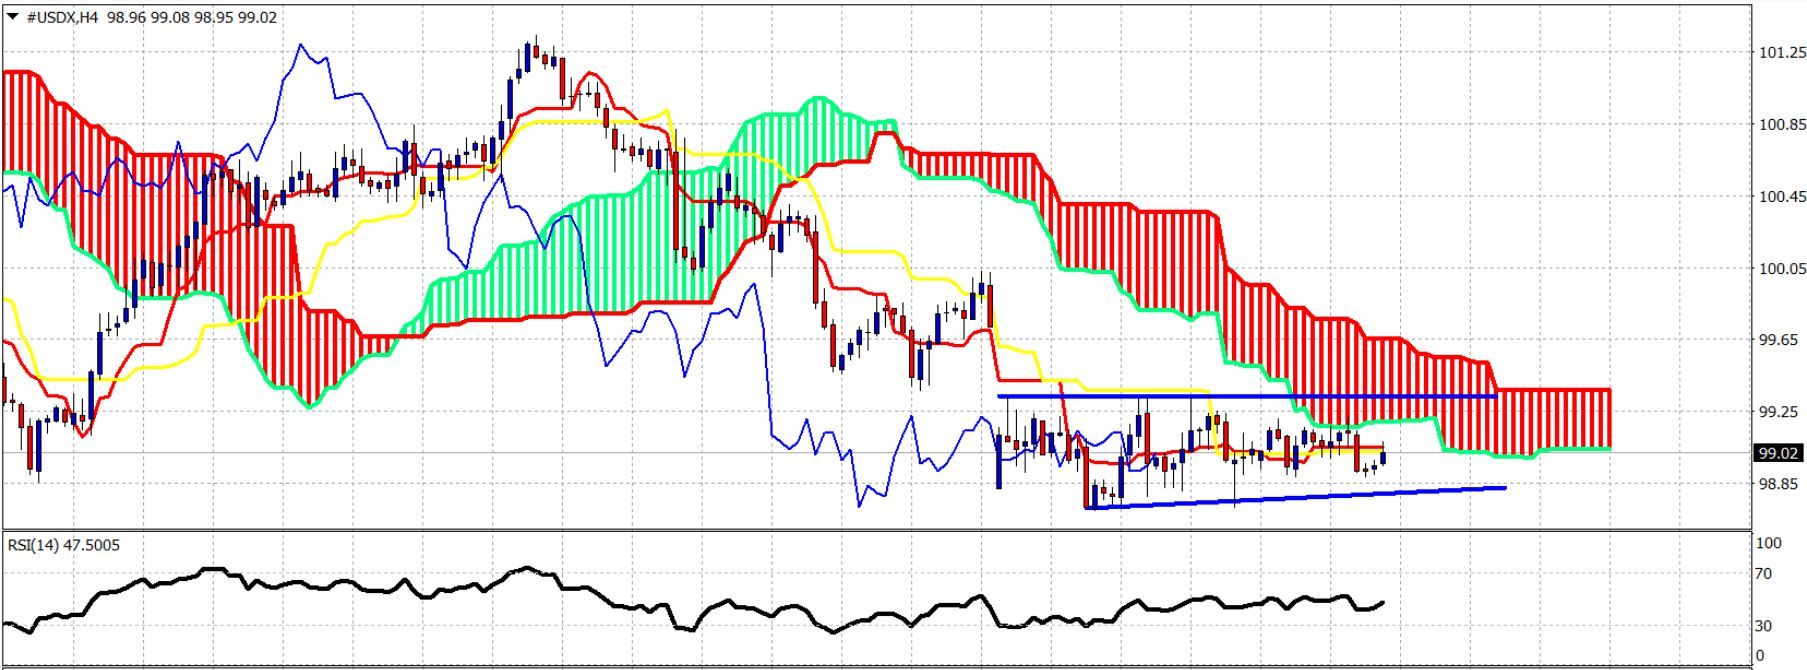
Blue lines – trading range
The Dollar index is trading below the Kumo. Trend is bearish on the 4-hour chart. Price is moving sideways for the last couple of days but I expect price first to make a break lower as a false breakdown and then reverse upwards.
Red line – resistance
Black line – support
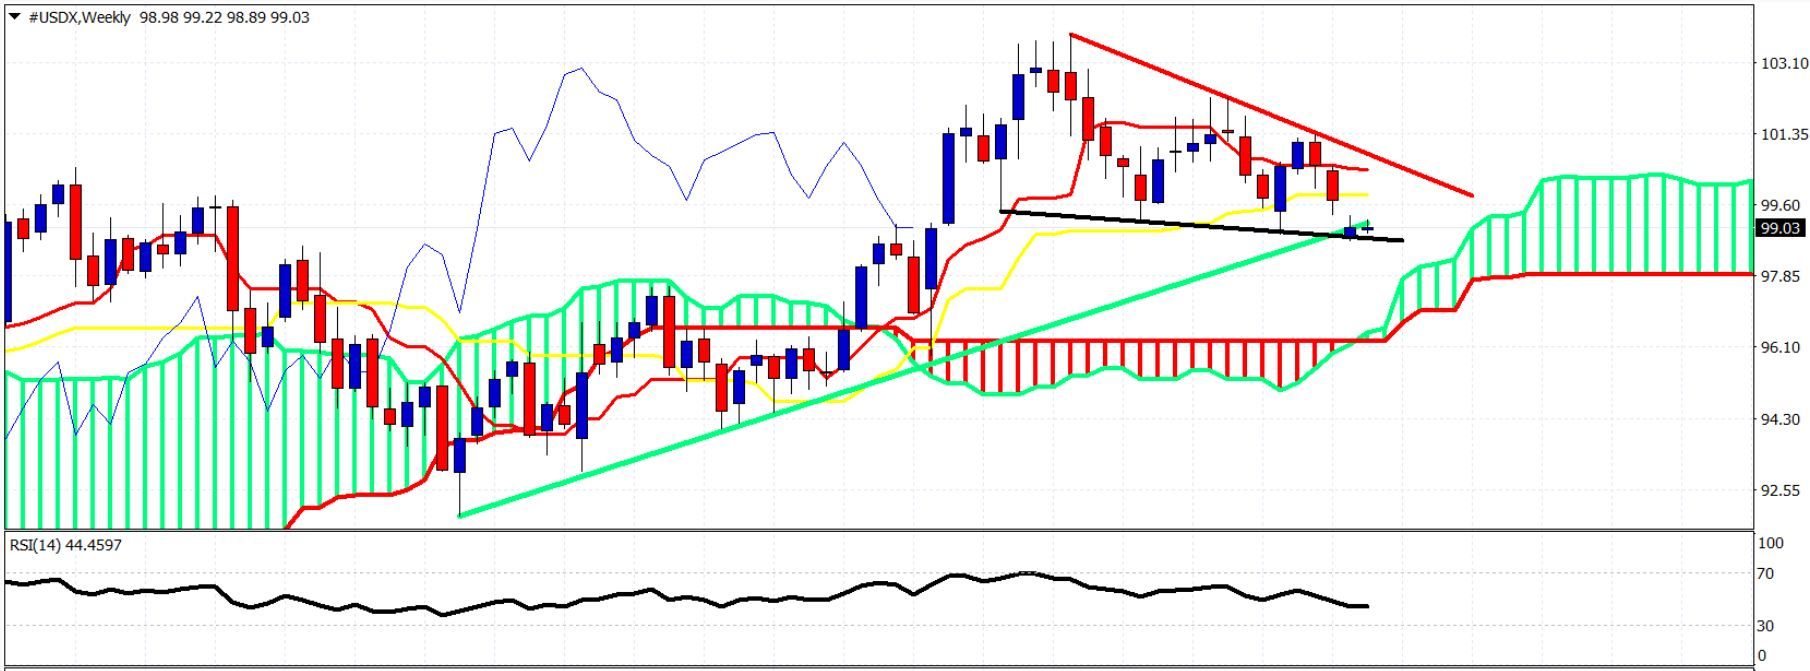
Green line – long-term support
Black line – support
Green line – long-term support
The Dollar index is at a very important long-term support junction. Price is right on top of support levels. At least a short-term bounce towards the red trend line resistance is expected. However the form of the decline from 103.50 suggests that the entire corrective decline is more probable and the up trend towards 112 will resume once the triangle pattern is broken upwards.


