


Gold price broke out of the triangle pattern last week and has made new highs above $1,265. Bulls need to continue to show improved strength so that we should not see the breakout as a false one. Short-term target and next important resistance is at $1,277-80.
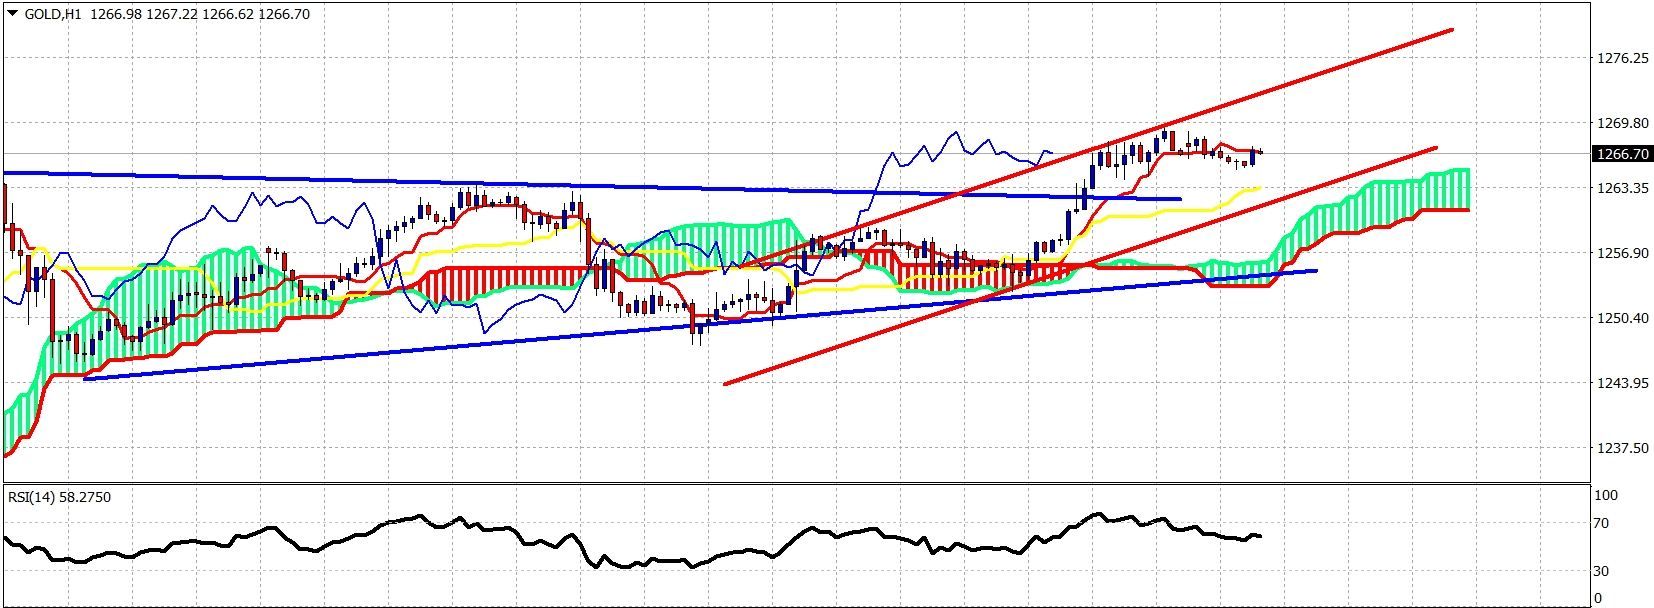 Blue lines – triangle
Red lines – bullish channel
Gold price is trading above the triangle pattern and inside the bullish channel. Short-term resistance at $1,277. Support is at $1,263 and next at $1,256. If support is broken, we could see Gold move towards $1,243.
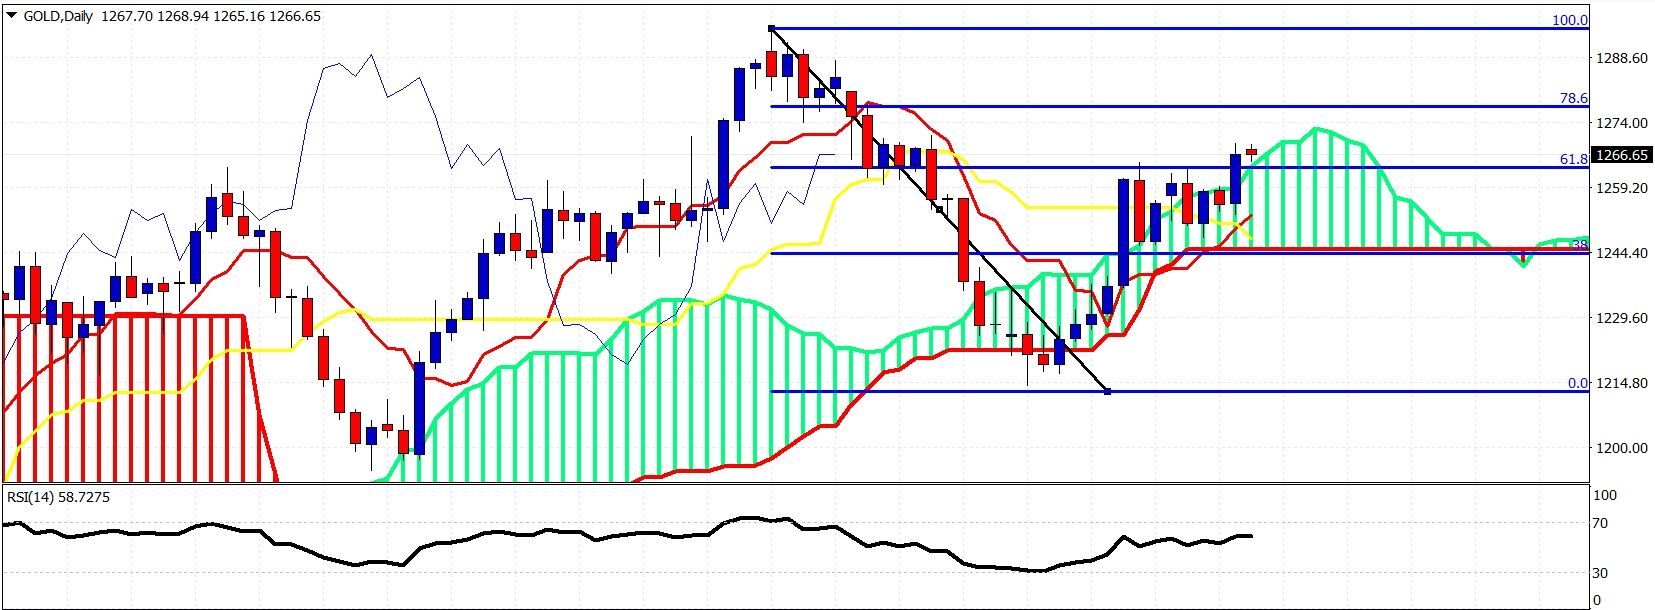 On the daily chart price has broken out of the Kumo. This is a bullish sign. However we have a small bearish divergence signal in the RSI (5). Important resistance is at $1,277 where we find the 78.6% Fibonacci retracement. Trend is bullish. A move towards $1,245 could not be ruled out and it would not change my longer-term bullish view.
Ichimoku indicator analysis of gold for May 29, 2017


