


The Dollar index remains in a bearish trend. Price is heading towards 99 where critical medium-term support is found. Only a break above 100.80 could change short-term trend to bullish again.
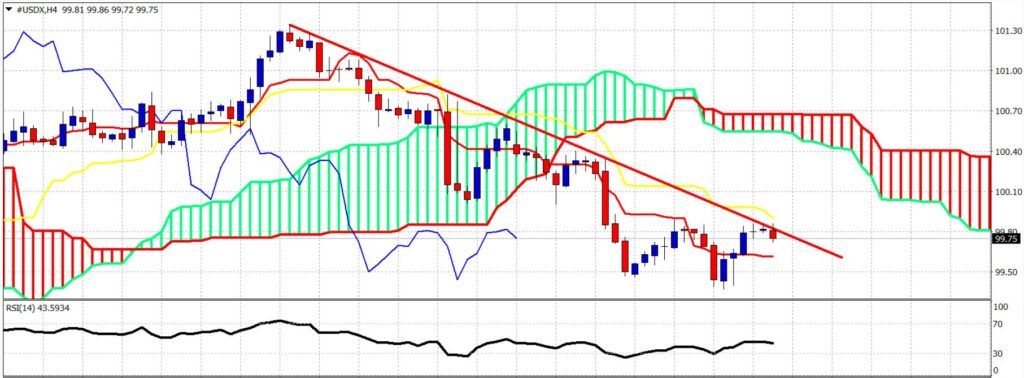
Red line – resistance The Dollar index is trading below the 4-hour Kumo which implies trend is bearish. Price is showing rejection signs at the red trend line resistance and at the 4-hour kijun-sen (yellow line indicator). Short-term support is at the tenkan-sen (red line indicator) at 99.60.
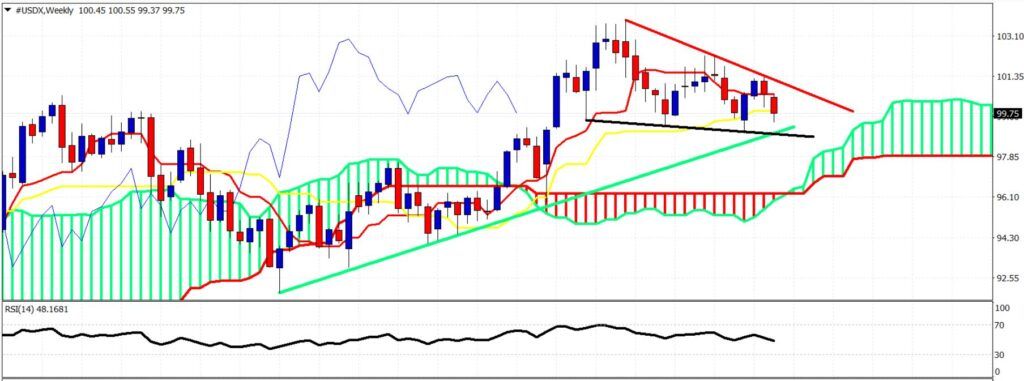
Red line – resistance Black line -support Green line – long-term support The Dollar index is still inside the triangle pattern in the weekly chart. Price is testing weekly kijun-sen support. A weekly close below it will open the way for a push towards 99 and why not a break below the green and black trend line for a push at least towards the weekly cloud support at 96-97.Only a break above the red trend line will revive the bullish hopes for new highs towards 110.


