


The Dollar index continues to trade above the 99-98.80 support area but the sideways consolidation in the short-term implies that more downside is expected. The downward move is not over but the risk reward does not favor bears.
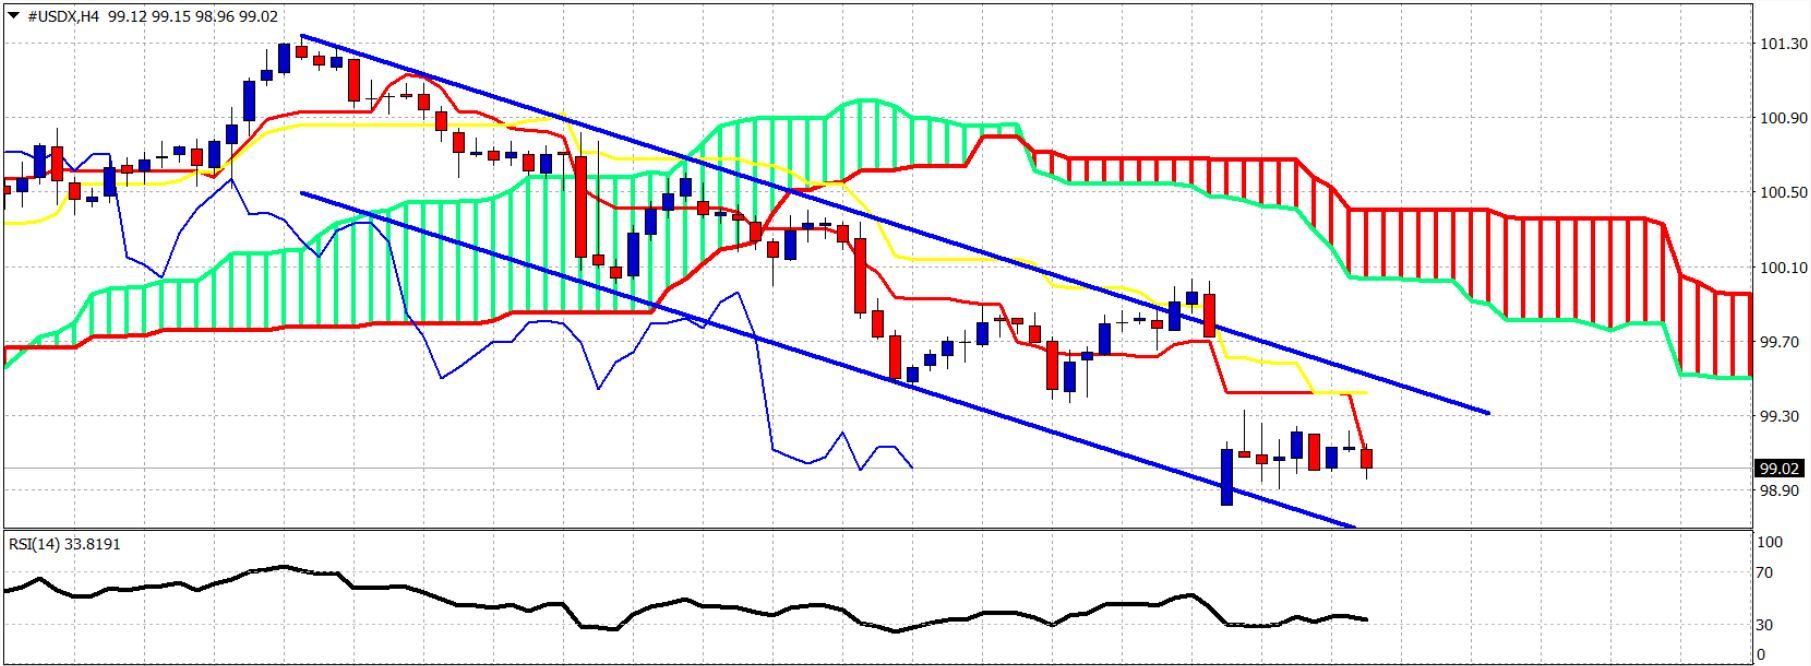
Blue lines – bearish channel
Short-term support is at 98.80. Resistance is at 99.30-99.50. Price remains in a bearish trend below both the tenkan- and kijun-sen indicators. Price is expected to make new lows towards 98 before it reverses upwards. Short-term indicators are diverging.
Short-term support is at 98.80. Resistance is at 99.30-99.50. Price remains in a bearish trend below both the tenkan- and kijun-sen indicators. Price is expected to make new lows towards 98 before it reverses upwards. Short-term indicators are diverging.
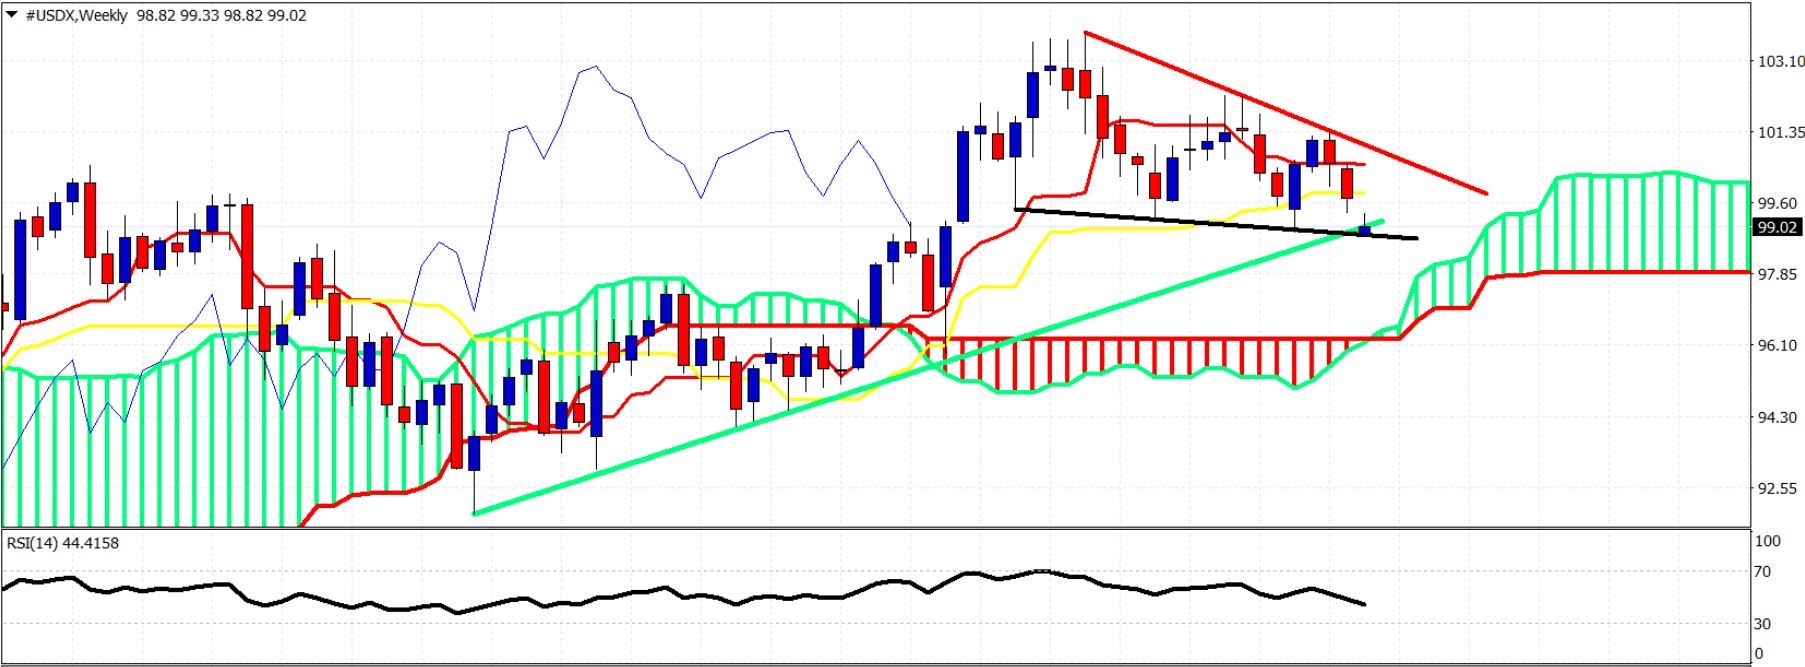
Red line – resistance
Black line – support
Green line – long-term support trend line
The weekly candle is below both the tenkan- and kijun-sen but above the Kumo (cloud). Trend is bearish as long as price is below 101.30 and the longer-term trend is also in danger if price breaks below the Kumo. If price breaks below the green long-term trend line the chances for a bounce towards the red resistance trend line diminish.


