


The USDJPY has reached an important resistance area and I expect a reversal from current levels at least towards 110. The trend remains bullish in all time frames and I still do not have a bearish signal confirmation.
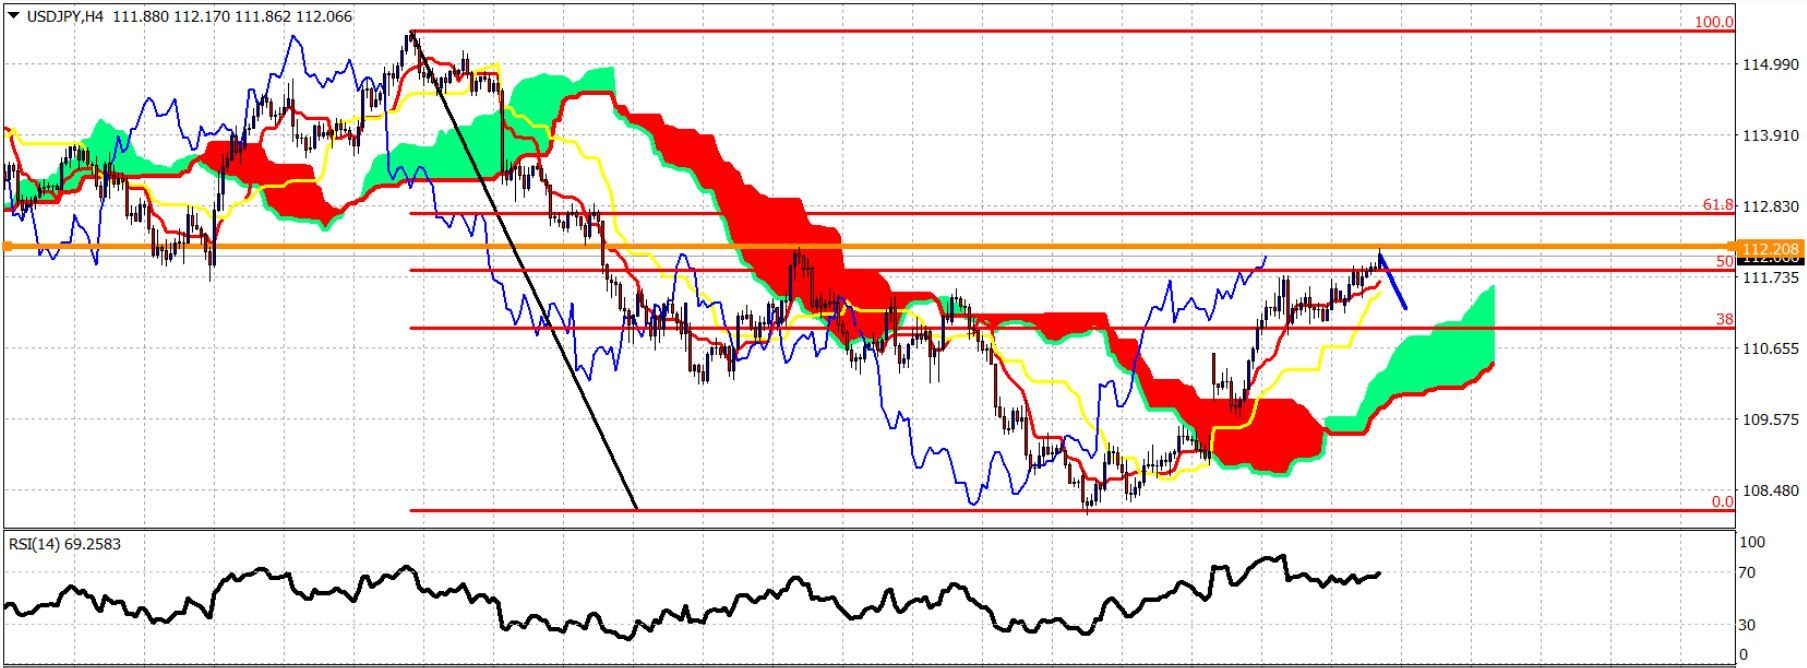
Orange horizontal line – resistance
The USDJPY has reached the horizontal orange resistance at 112.20 and the 50% Fibonacci retracement from the 115.60 highs in March. The price remains in a short-term bullish trend as the price is above the Kumo (cloud).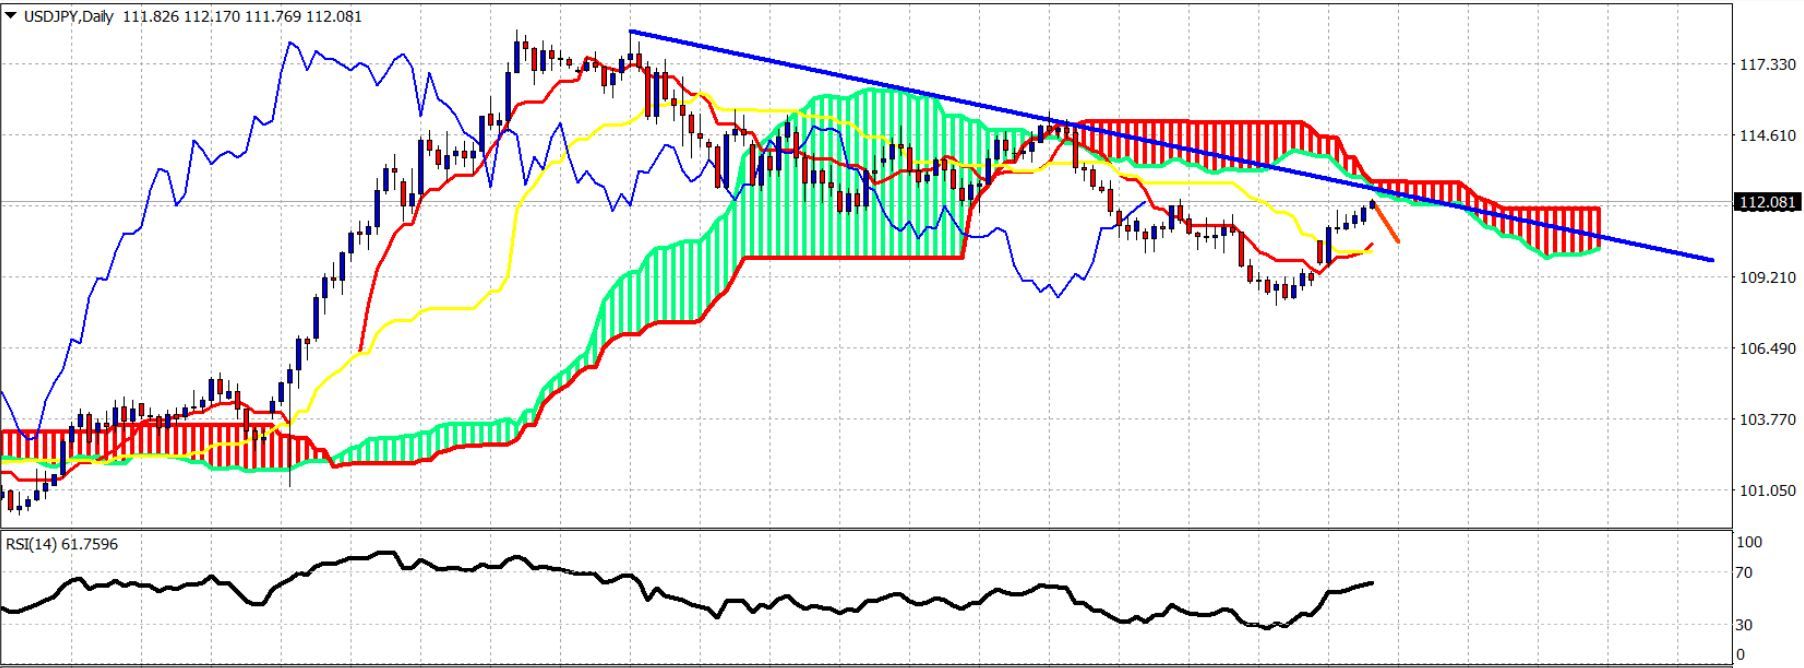
The USDJPY has reached the horizontal orange resistance at 112.20 and the 50% Fibonacci retracement from the 115.60 highs in March. The price remains in a short-term bullish trend as the price is above the Kumo (cloud).
Blue line – long-term resistance trend line
With the USDJPY pair just below the blue trend line resistance and the Daily Kumo (cloud), a rejection at 112-112.50 will be a very bearish sign that would push the price towards 110 at least. So bulls should be very cautious as the upside potential is limited.
With the USDJPY pair just below the blue trend line resistance and the Daily Kumo (cloud), a rejection at 112-112.50 will be a very bearish sign that would push the price towards 110 at least. So bulls should be very cautious as the upside potential is limited.


