The US dollar index remains in a bearish trend below the important resistance, moving sideways for the last couple of sessions. The price may reach lower levels if support at 98.80 is broken, but overall I believe the US dollar has a scope for a bounce.
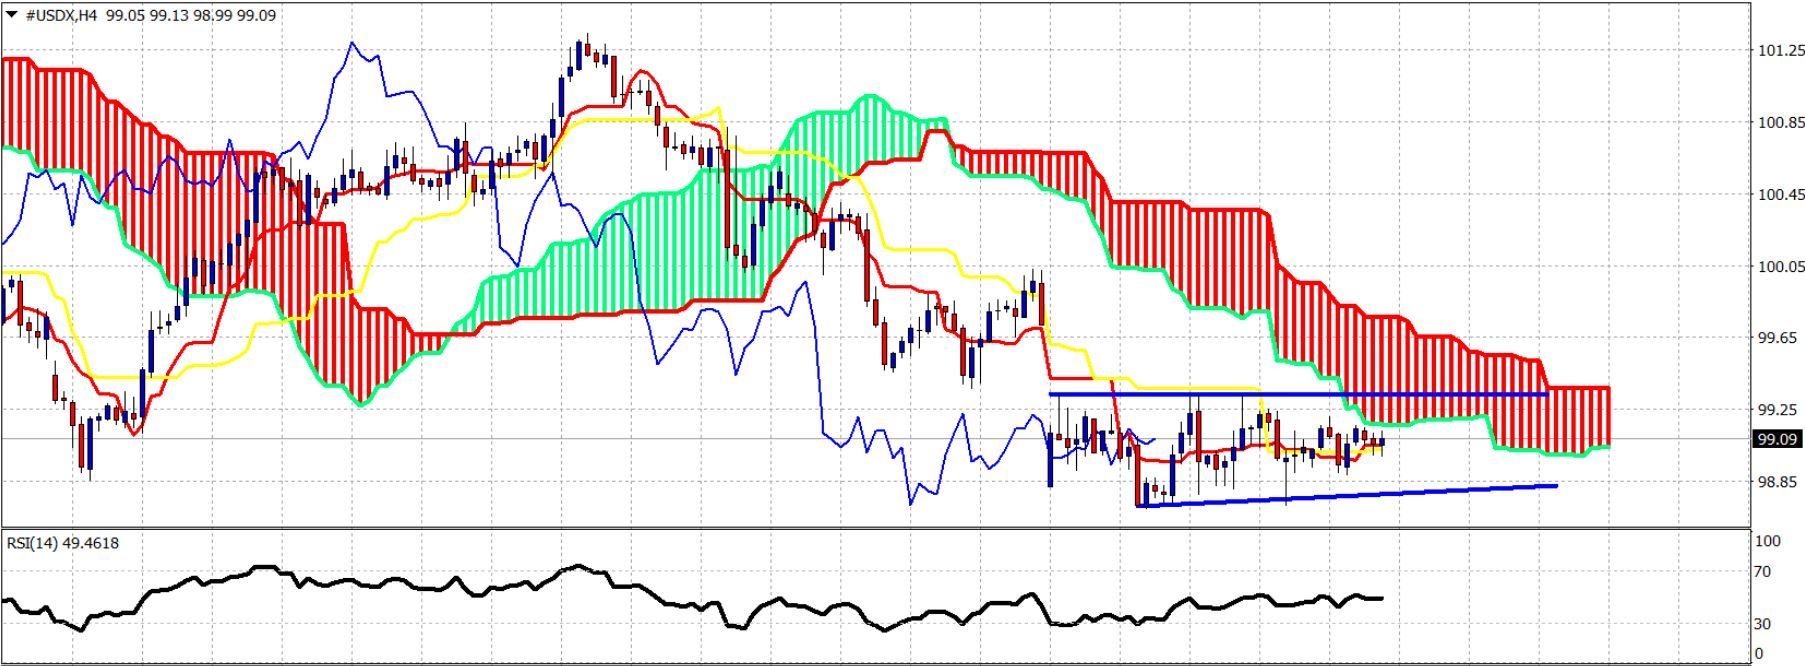
Blue lines – trading range
On the 4 hour chart the price remains below the Kumo (cloud) an d between the blue trend lines. Resistance is at 99.35 and support lies at 98.80. A break above the cloud at 99.60 will open the way for a bigger upward reversal. Breaking below 98.80 will open the way for a push lower towards 98-97.
On the 4 hour chart the price remains below the Kumo (cloud) an d between the blue trend lines. Resistance is at 99.35 and support lies at 98.80. A break above the cloud at 99.60 will open the way for a bigger upward reversal. Breaking below 98.80 will open the way for a push lower towards 98-97.
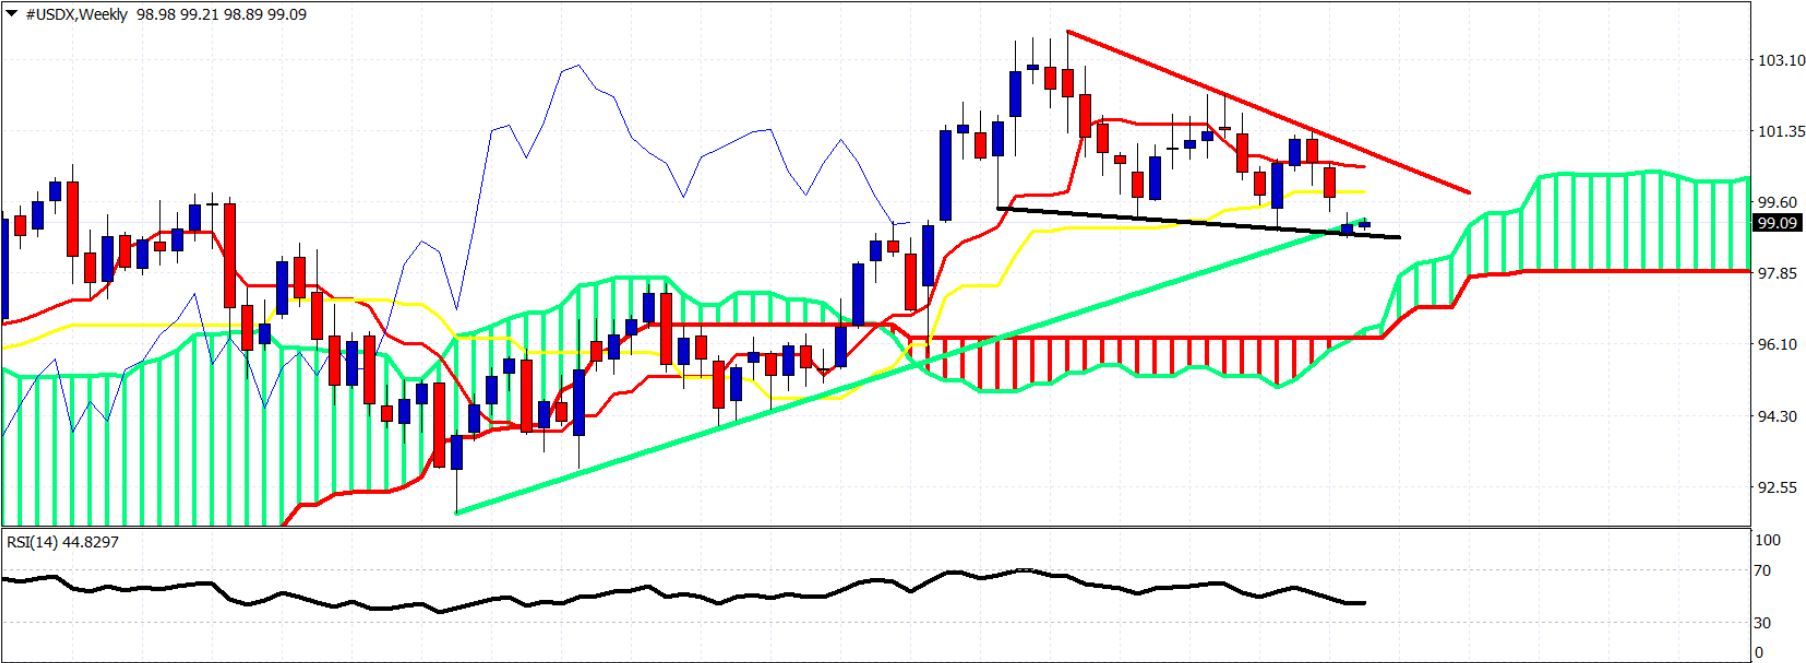
Red line – resistance
Black line – support
Green line – long-term trend line supportOn a weekly basis we remain above critical long-term trend lines and support. However, there is still no reversal signal. I expect the dollar index to reverse towards at least the red trend line resistance. The form of the decline from 103.30 could be seen corrective and a break above the last high at 101.30 could confirm long-term trend reversal targeting 110-112. The price remains above the weekly cloud and this keeps bulls’ hopes up.