


The Dollar index could hold above resistance yesterday and got rejected and pushed to new lows. Trend remains bearish and as long as price is below 99.40 trend will remain bearish looking for a test of 98.
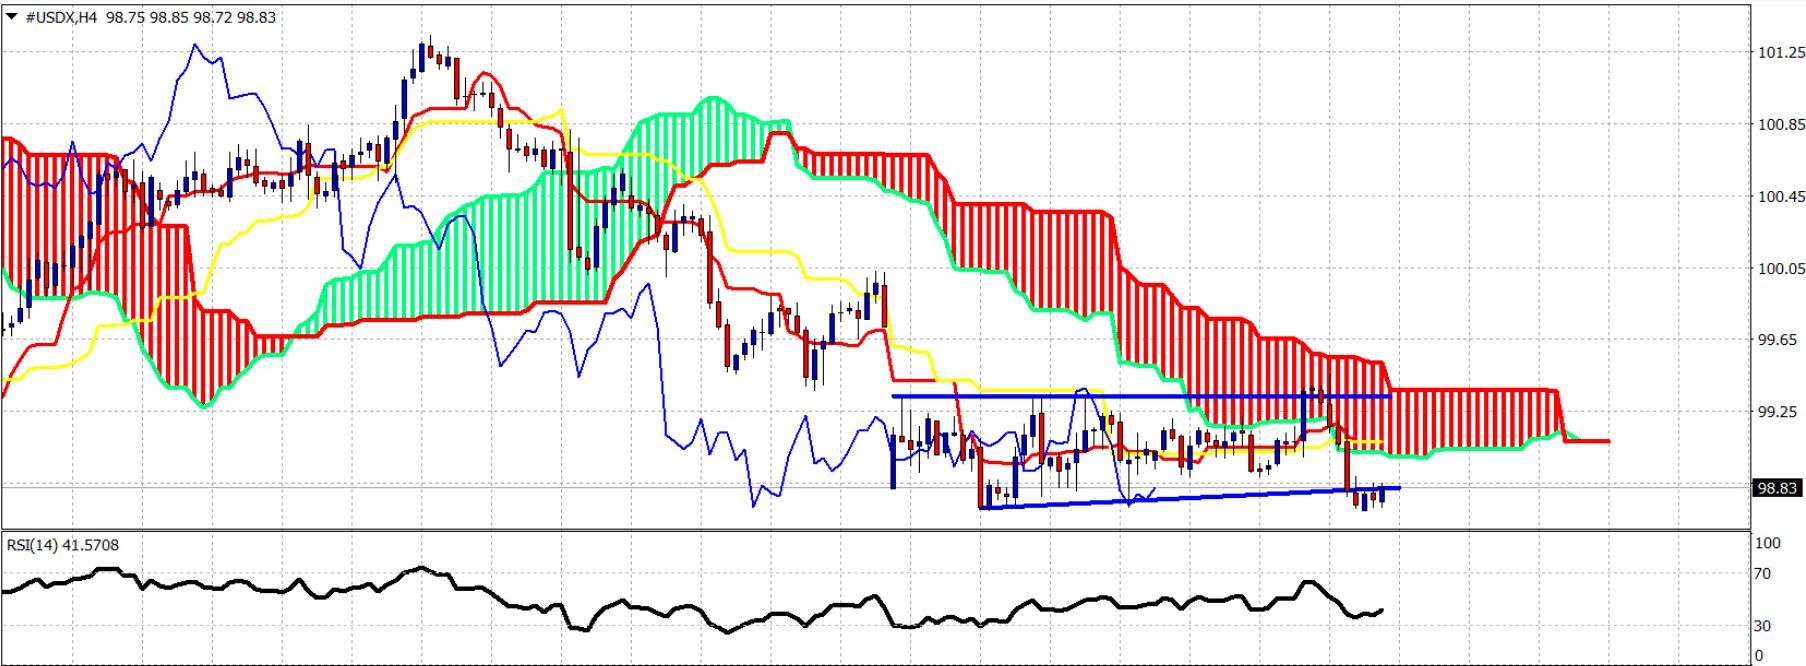
Blue lines – trading range
The Dollar index got rejected at the upper boundary of the trading range and is breaking below it. Price got rejected at cloud resistance and is now trading below both the tenkan- and kijun-sen indicators. There are short-term oversold signals that could justify a bounce towards 99 where the lower cloud boundary resistance is found.
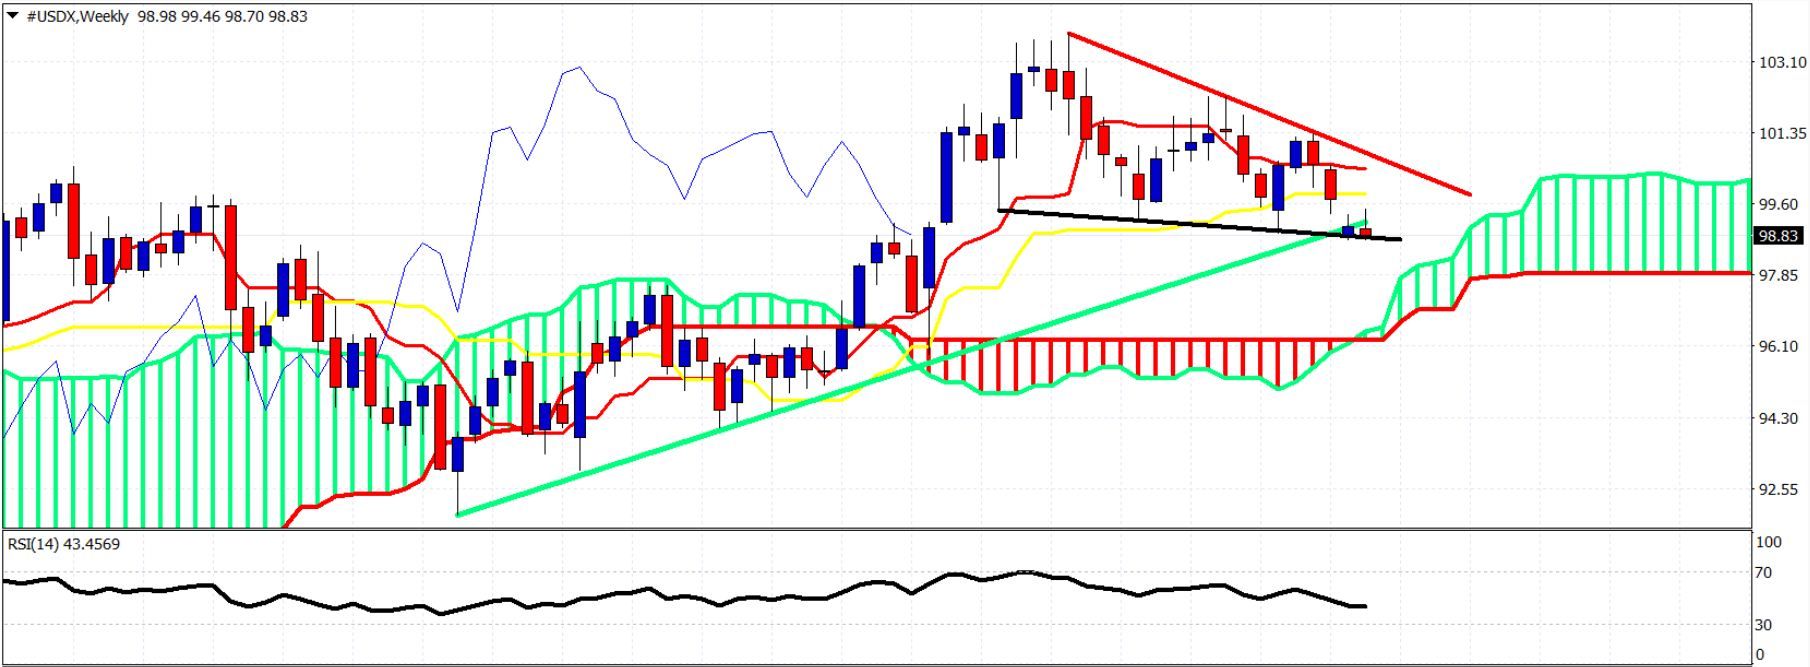
Green line -long-term trend line support
Black line – support
Red line – resistance
Black line – support
Red line – resistance
The Dollar index is sliding along the black trend line support but is breaking below the green long-term upward sloping trend line support. We should expect the Dollar index to test the weekly cloud support at 97. From that level we should expect a bounce probably towards the broken green trend line as a back test. As long as price is below 101.30 trend is bearish.


")


