


Gold price has broken to new lows yesterday but is very close to making an important bottom reversal if it has not already bottomed. Gold price should bounce at least towards $1,260-70. There are many signs of bullish divergence and similar to when Gold was at $1,194.
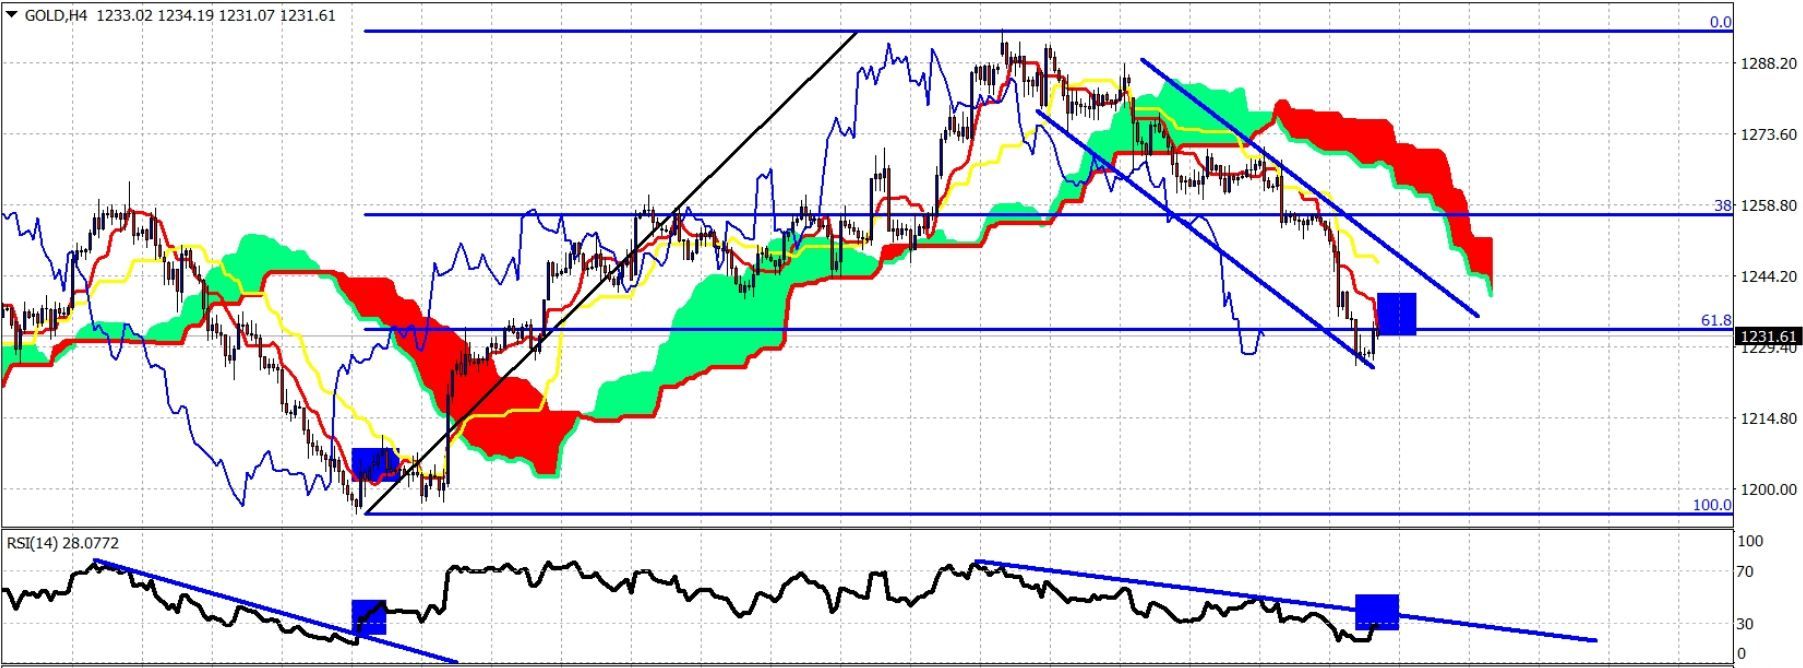
Gold continues to trade below the Ichimoku cloud and both the tenkan- and kijun-sen. Short-term trend is bearish. Resistance is at $1,250 and next at $1,260-70. Support is at $1,220-$1,200.
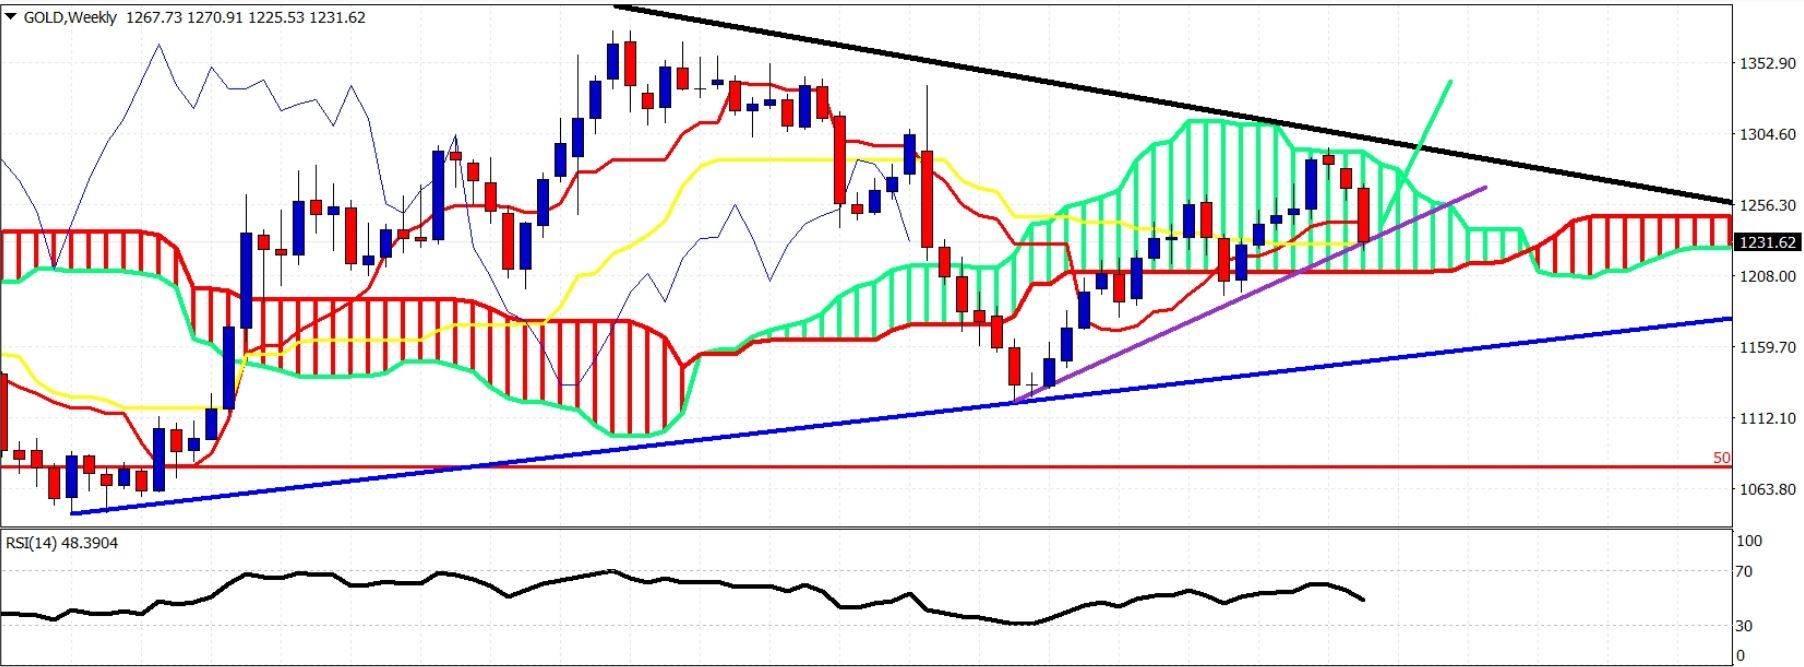
Purple line – support
Blue line -long-term support
Black line – long-term resistance
Blue line -long-term support
Black line – long-term resistance
Gold price was rejected a couple weeks ago at the long-term resistance trend line and the upper cloud boundary. Price is now testing the purple trend line support and the weekly kijun-sen (yellow line indicator). A bounce is expected from current levels. However, a break below $1,220-$1,210 on a weekly basis will imply that Gold should move even lower towards $1,160. My long-term view remains bullish expecting Gold towards $1,500.


