


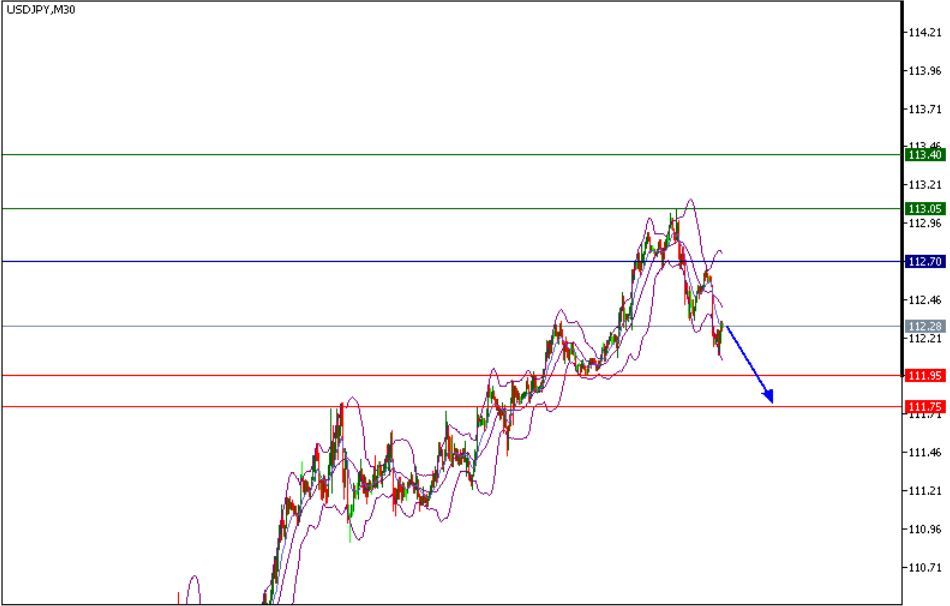
Key resistance of USD/JPY is seen at 112.70. The pair is rebounding and is challenging the declining 20-period moving average. Nevertheless, the key level at 112.70 as well as the 50-period moving average are playing resistance roles. The relative strength index is below its neutrality level at 50 and lacks upward momentum. As long as 112.70 holds on the upside, look for a further drop towards 111.95 and even 111.75 in extension. The pair is trading above its pivot point. It is likely to trade in a wider range as long as it remains above its pivot point. Therefore, long positions are recommended with the first target at 113.15 and the second one at 113.40. In the alternative scenario, short positions are recommended with the first target at 111.95 if the price moves below its pivot points. A break of this target may push the pair further downwards, and one may expect the second target at 111.75.
The pivot point lies at 112.25.
The pivot point lies at 112.25.
Resistance levels: 113.05, 113.40, and 113.85
Support levels: 111.95, 111.75, and 111.20


