


The Dollar index is trading below important long-term support but it shows reversal signs. As said in previous posts, the downside is limited as the RSI indicators are on the oversold territory and diverging in the short term, justifying a bounce towards 99.
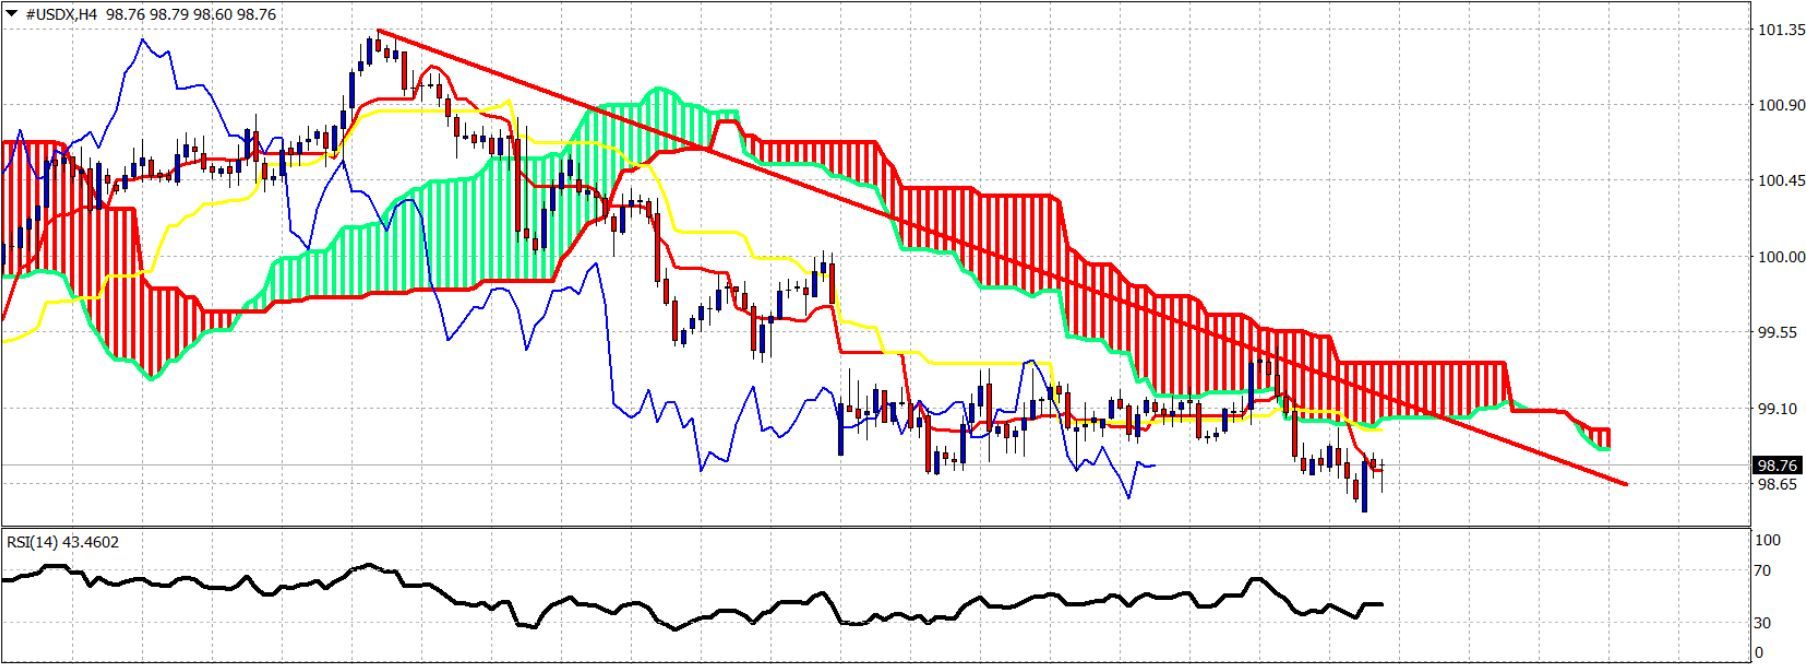
Red line – resistance
The Dollar index is trading below the 4-hour Kumo. Trend remains bearish. Short-term resistance is at 99. Support is at 98. If we break above 99, we could see a stronger bounce towards 100. However medium-term trend will change to bullish only on a break above 101.40.
Red line – resistance
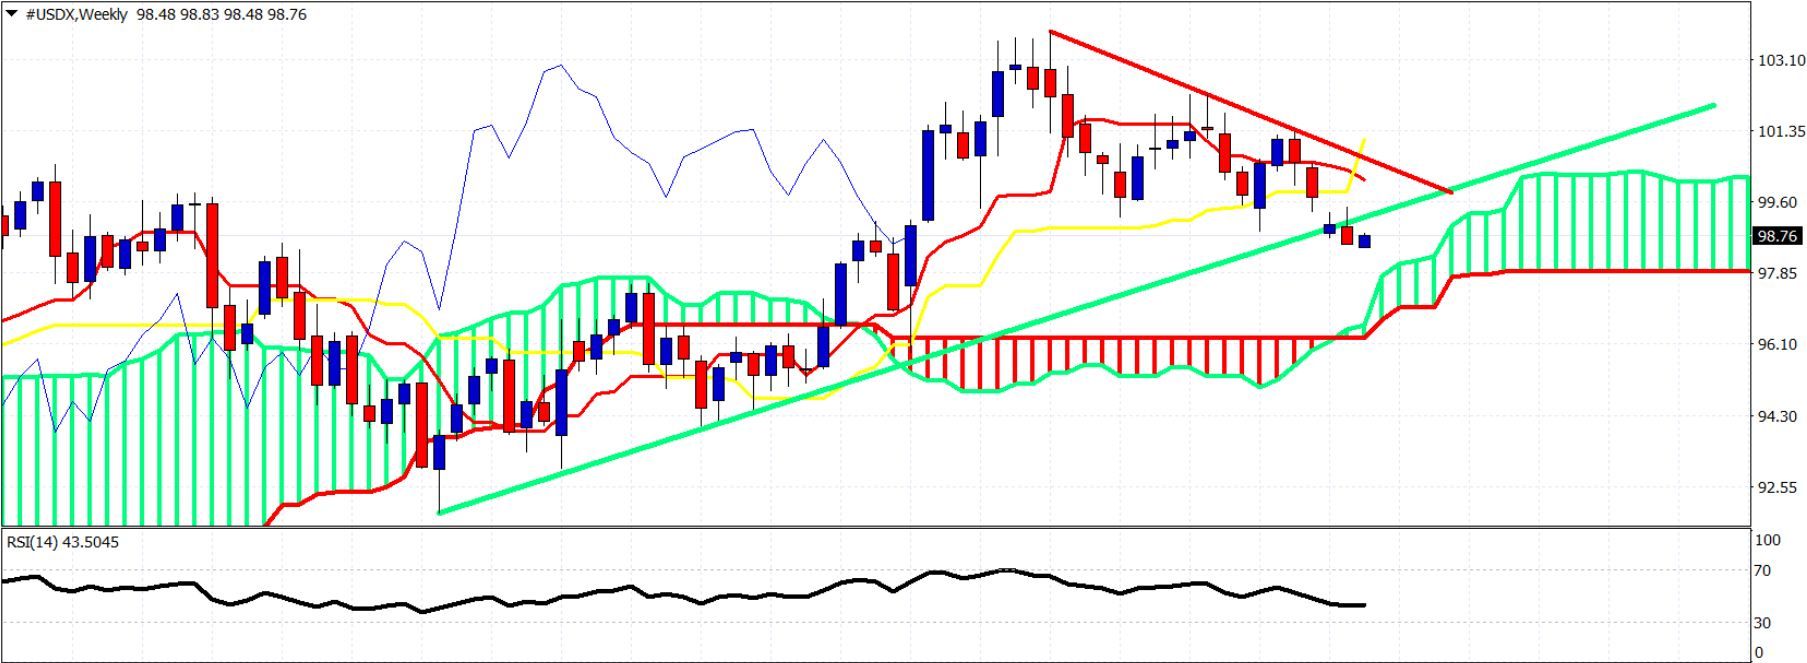
Green line – long-term support trend line
Green line – long-term support trend line
We expect the Dollar index to produce a bounce from current levels towards the weekly kijun- and tenkan-sen indicators around 100.20-100 where we also find the red trend line resistance. As long as price is below the red trend line resistance and below 101.40, I will tend to favor the bearish scenario for a move towards 94. Confirmation will come with the break below 97.


