


Gold price made a lower low in early Asian trade this morning but the RSI is showing some glaring divergence signs. Gold price reversed sharply upwards implying that the downside is most probably limited and a bounce has started.
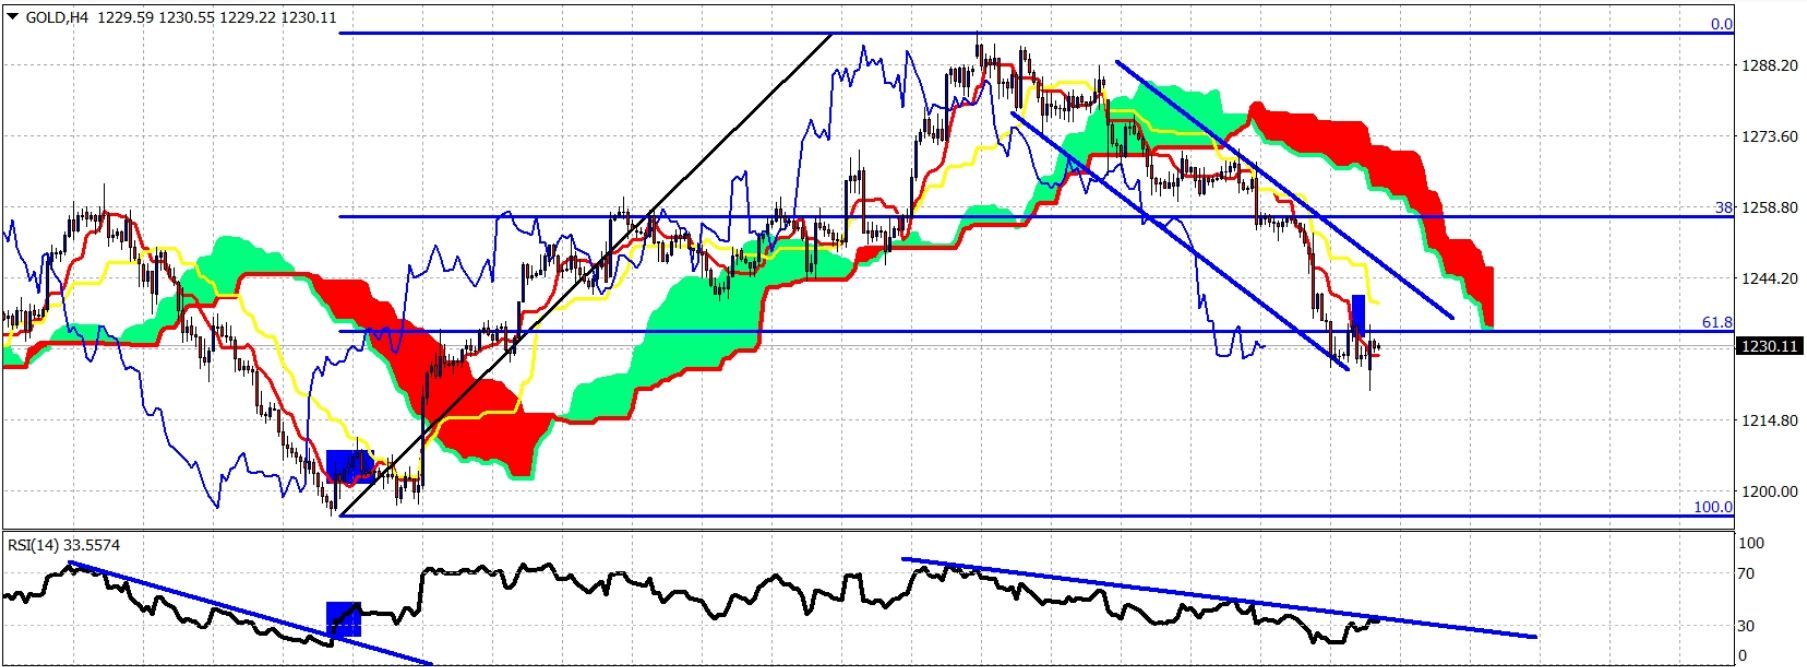
Gold is oversold and is showing divergence signs in the both RSI indicators. Price is trading below both the tenkan- and kijun-sen. Trend remains bearish but I expect Gold price to make a strong bounce towards $1,260at least for the shortterm.
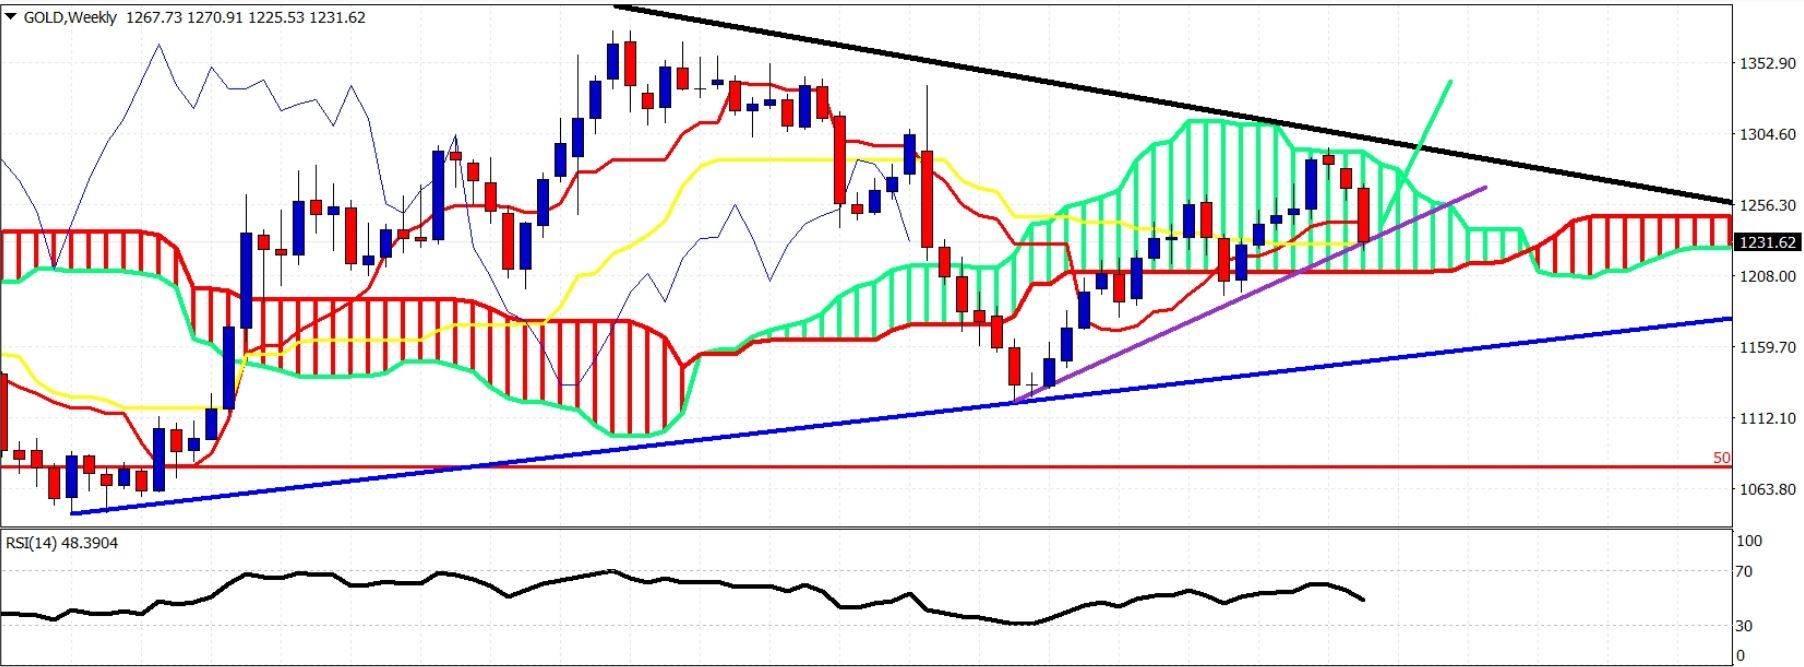
Gold price remains trapped inside the long-term triangle. Price is inside the weekly cloud confirming trend is neutral on a weekly basis. Price bounced from the lower cloud boundary and remains above the weekly kijun-sen. I expect support at $1,220-$1,210 to hold and produce a move towards at least the upper cloud boundary at $1,260.


