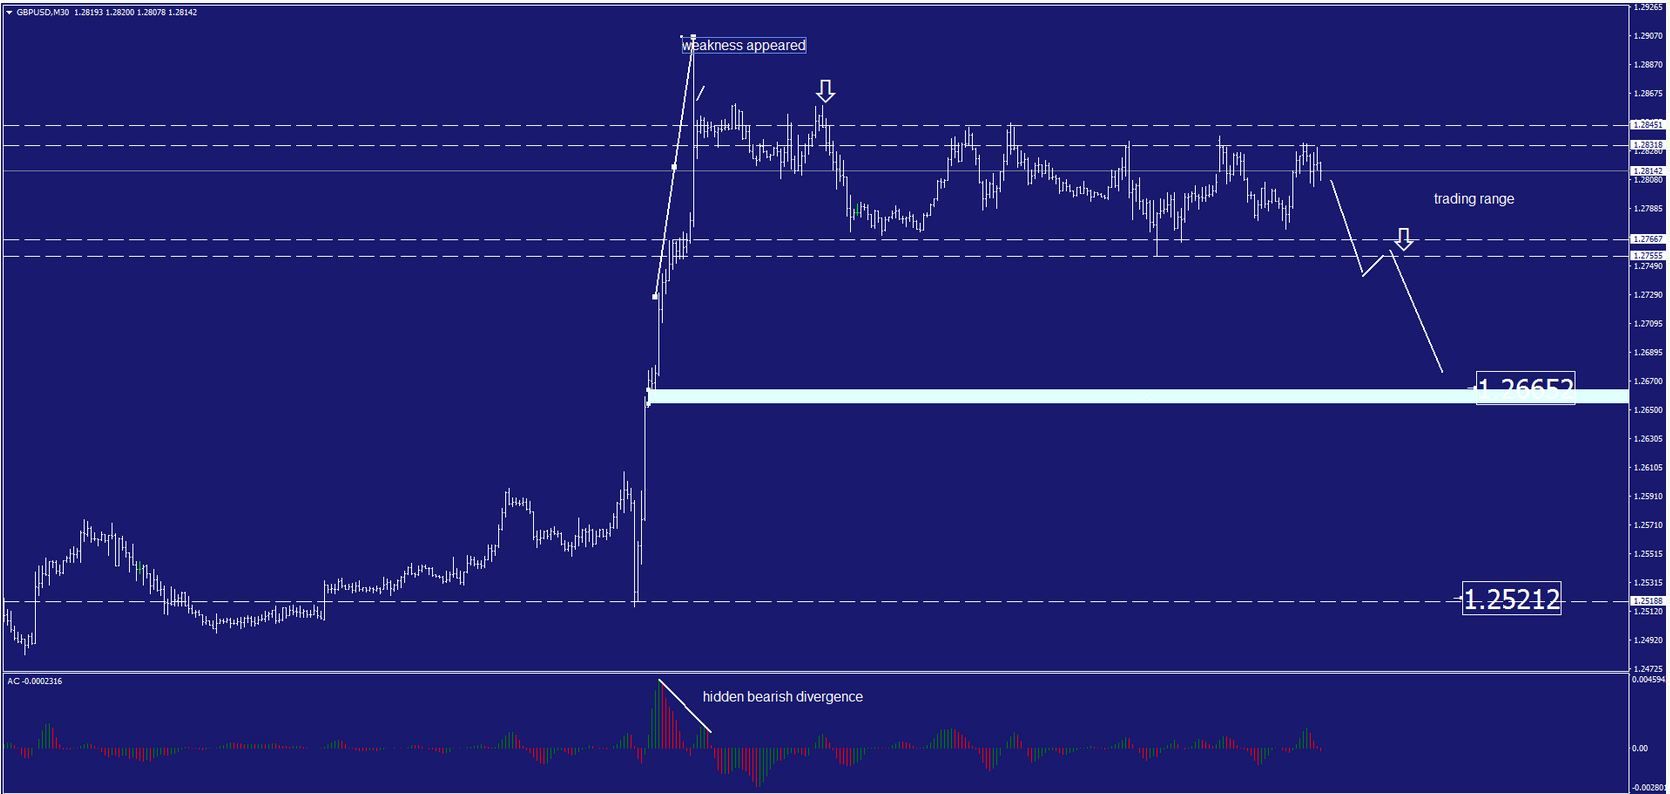
Recently, the GBP/USD pair has been trading sideways at the price of 1.2815. According to the 30M time frame, I found a strong sign of weakness in the background and a trading range between the price of 1.2755 (support) and 1.2860 (resistance). Since there is weakness in the background and hidden bearish divergence on the oscilator, my advice is to watch for potential breakout of support to confirm a downward movement. If the price breaks the level of 1.2755, watch for selling opportunities. The downward targets are set at the price of 1.2665 and 1.2520.
Resistance levels:
R1: 1.2845
R2: 1.2870
R3: 1.2885
S1: 1.2805
S2: 1.2785
S3: 1.2750
Trading recommendations for today: watch for potential selling opportunities.